


Transient enhancement of stimulus-evoked activity in neocortex during sensory learning
- Corresponding author: albarth{at}andrew.cmu.edu
Abstract
Synaptic potentiation has been linked to learning in sensory cortex, but the connection between this potentiation and increased sensory-evoked neural activity is not clear. Here, we used longitudinal in vivo Ca2+ imaging in the barrel cortex of awake mice to test the hypothesis that increased excitatory synaptic strength during the learning of a whisker-dependent sensory-association task would be correlated with enhanced stimulus-evoked firing. To isolate stimulus-evoked responses from dynamic, task-related activity, imaging was performed outside of the training context. Although prior studies indicate that multiwhisker stimuli drive robust subthreshold activity, we observed sparse activation of L2/3 pyramidal (Pyr) neurons in both control and trained mice. Despite evidence for excitatory synaptic strengthening at thalamocortical and intracortical synapses in this brain area at the onset of learning—indeed, under our imaging conditions thalamocortical axons were robustly activated—we observed that L2/3 Pyr neurons in somatosensory (barrel) cortex displayed only modest increases in stimulus-evoked activity that were concentrated at the onset of training. Activity renormalized over longer training periods. In contrast, when stimuli and rewards were uncoupled in a pseudotraining paradigm, stimulus-evoked activity in L2/3 Pyr neurons was significantly suppressed. These findings indicate that sensory-association training but not sensory stimulation without coupled rewards may briefly enhance sensory-evoked activity, a phenomenon that might help link sensory input to behavioral outcomes at the onset of learning.
Learning-related plasticity is ubiquitous across neocortical circuits, where changes in both anatomy and the response properties of neurons have been described across a wide range of areas, from motor cortex to primary sensory cortex to association cortex. For example, anatomical and functional synaptic changes have been observed in sensory cortex during learning, where pyramidal (Pyr) neurons in layer 2/3 and layer 5 show an increase in spine density at the initial stages of learning in a tactile object localization task (Kuhlman et al. 2014; Roth et al. 2020), and thalamocortical plasticity from higher-order inputs into the primary somatosensory cortex (S1) has been detected during whisker-dependent learning (Audette et al. 2019; La Terra et al. 2022; Qi et al. 2022).
In vivo imaging and recording experiments in sensory cortex have taken advantage of head-fixed training regimens and longitudinal imaging to examine how task-related sensory activity is modified during various forms of reinforcement learning (Chéreau et al. 2020; Gilad and Helmchen 2020; Pardi et al. 2020; Lee et al. 2021). In general, analysis of the dynamic properties of neurons during task performance has revealed subtle shifts in stimulus- and decision-related activity as animals become experts in a task. For example, in somatosensory cortex a projection-defined class of L2/3 neurons shows enhanced choice and reward activity in a texture-discrimination task (Chen et al. 2015; Condylis et al. 2020). In somatosensory cortex, learning may recruit previously nonresponsive neurons, particularly in expert animals (Bale et al. 2021; Rabinovich et al. 2022). Learning in a visual discrimination task alters the dynamic response properties of neurons in primary visual cortex, increasing selectivity to task stimuli (Poort et al. 2015; Khan et al. 2018; Henschke et al. 2020; Kim et al. 2020), and can sharpen tuning and contrast sensitivity even before behavioral differences are apparent (Jurjut et al. 2017).
Despite these sophisticated efforts, it is remarkable that robust, learning-associated changes in neural activity, particularly in superficial layers where synaptic changes have been well-documented, have been difficult to detect (De Lafuente and Romo 2005; O'Connor et al. 2010; Gdalyahu et al. 2012; Peron et al. 2015; Condylis et al. 2020; Lee et al. 2021). This may be attributed to the behavioral training paradigm used, in which animals are head-fixed and typically water-deprived, to enhance motivation to perform, or to the timing of imaging or recording, which typically focus on naive or expert animals. Indeed, anatomical and electrophysiological measurements suggest that changes in neocortical neurons during experience and learning are frequently short-lived, detected most prominently in the early stages of training (Alain et al. 2007; Reed et al. 2011; Gilad and Helmchen 2020; Ray et al. 2023). Furthermore, in some studies, sensory learning has been associated with a reduction in evoked responses over the course of training (Makino and Komiyama 2015; Puścian et al. 2020).
Here, we work from well-documented and pathway-specific synaptic changes that have been characterized in acute brain slices and fixed tissue at the onset of learning in a whisker-dependent sensory-association task (Audette et al. 2019; Kuljis et al. 2020; Ray et al. 2023) to investigate how sensory-evoked activity is changed as animals learn a simple sensory-reward-association task. Importantly, imaging of sensory responses was carried out in brief daily sessions, outside of the training context, to examine stimulus-evoked activity in the absence of reward and other cues associated with the homecage training environment.
Because synaptic changes in prior studies were identified in acute brain slices and fixed tissue, long-lasting alterations in synapse properties are not task- or brain-state-dependent but are stably encoded in synaptic function and anatomy. In addition, our previous studies showed synaptic changes were not concentrated in a small subset of “engram cells” but were broadly distributed across Pyr neurons (Audette et al. 2019; Lee et al. 2021). Thus, it was reasonable to hypothesize that stimulus-evoked activity tracked using longitudinal imaging of the genetically encoded Ca2+ indicator gCaMP6f (Chen et al. 2013) outside of the training context might reveal alterations in evoked activity during the course of learning.
Despite these synaptic changes, we did not observe marked changes in stimulus-evoked activity during the daily imaging sessions that were carried out across the training period. Multiwhisker stimulation drove a modest increase in Ca2+ transients in L2/3 Pyr neurons within barrel cortex at the onset of training, an increase that was not restricted to the trained stimulus direction. These changes rapidly renormalized as animals learned the task. In contrast, animals exposed to whisker stimulation without coupled rewards showed a significant reduction in evoked responses that was maintained over time. Finally, the cohort of animals used for longitudinal imaging enabled us to identify correlations between stimulus-evoked activity and task performance across different training conditions. We found that as animals learned the stimulus–reward association, task performance became negatively correlated with stimulus-evoked activity, suggesting that enhanced activity in L2/3 Pyr neurons is not required to maintain the learned association.
Results
Multiwhisker sensory stimulation drives sparse activity in superficial layers of mouse somatosensory cortex
Initially, we characterized GCaMP6f responses from L2/3 Pyr neurons in the S1 barrel field (S1BF) of awake mice evoked by multiwhisker stimulation, using a gentle airpuff (4–6 psi, 500 msec) positioned above the right facial vibrissae. Imaging was carried out in head-fixed animals, outside of the training context, to remove possible confounds caused by motivational state and water deprivation. Data were collected from daily imaging sessions of animals that underwent 6 days of acclimation (ACC) to the homecage training environment (ACC; see Materials and Methods) followed by 10 days of sensory-association training (SAT), in which a gentle airpuff (4–6 psi, 500 msec) to the right facial vibrissae was coupled with a delayed (500 msec) water reward (Fig. 1A–D; see Materials and Methods; Audette et al. 2019; Bernhard et al. 2020). We first characterized the response properties of neurons during this ACC period.
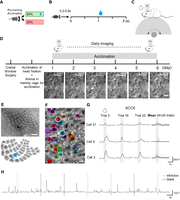
Longitudinal two-photon calcium imaging of S1BF. (A) Water release probability during cage ACC. (B) Trial structure. A nose poke into the IR beam initiates the onset of a trial. A random delay period (0.2–0.8 sec) is followed by a fixed 1 sec delay before water delivery. (C) Schematic of two-photon calcium imaging setup, with an animal head-fixed on a wheel. (D, Top) Experimental time line for longitudinal calcium imaging. (Bottom) Longitudinal imaging of the same field of view (FOV) across ACC days. Scale bar, 30 µm. (E) Post hoc labeling of imaging site with methyl blue. Scale bar, 500 µm. (F) Cell masks of an example imaging FOV. Scale bar, 20 µm. (G) Example traces of airpuff-evoked responses and the mean calcium traces from the same cell across all trials on ACC day 6. F (fluorescence) is reported in arbitrary units. Light gray lines indicate individual trials, and black lines indicate the mean response to airpuff. The gray shaded area indicates the duration of airpuff. (H) Example trace of a cell within an imaging session. Blue lines indicate airpuff onset and offset. Black lines indicate blank trial onset and offset. Airpuff lasted for 0.5 sec. Airpuff trials and blank trials were randomly interleaved. The intertrial interval was 20 sec.
Prior studies have shown that multiwhisker stimuli can drive both subthreshold activity and Pyr cell firing in vivo (Jouhanneau et al. 2014). In each animal, we imaged the airpuff-evoked responses of glutamatergic neurons using the expression of GCaMP6f in slc17a7-Cre × Ai93 transgenic mice. One to two FOVs in superficial layers of S1BF containing 18–44 Pyr neurons were imaged per animal (Fig. 1E,F; Supplemental Fig. S1A,B; n = 9 mice [Harris et al. 2014; Kowalewski et al. 2021]).
Whisker-evoked responses were evaluated during a 1 sec period starting at stimulus onset, to capture the full profile of Ca2+ signals (Fig. 1G,H). To reduce potential habituation to the stimulus, we only delivered a small number of stimuli (10–20) across a 20 min imaging session. Under these conditions, we did not observe a progressive reduction in the evoked Ca2+ response for L2/3 neurons either within an imaging session (Supplemental Fig. S2A) or across sessions during the 6-day ACC period before association training (Supplemental Fig. S2B–E). Overall, the population mean of the stimulus-evoked response for L2/3 neurons remained stable across trials within a given day and across the ACC days, suggesting that sensory-driven responses did not acutely habituate over our imaging period (Supplemental Fig. S2).
Evaluation of neural activity during the ACC period enabled us to characterize airpuff-evoked responses (Supplemental Fig. S3A–C). Stimulus-evoked activity was sparsely distributed across the population of imaged neurons, where the majority of cells failed to show a significant stimulus-evoked response on any given trial (72 ± 0.6%, animal average for 6 days of ACC to the training cage environment [ACC1–6; n = 9 animals]). Thus, ∼25% of the neurons responded to a given stimulus trial. However, within an imaging session, >94% of neurons showed a significant response for at least one trial. These data indicate that elevated response probability was not concentrated in a small subset of cells: Almost all neurons showed responses on at least some trials. These Ca2+ imaging data are consistent with prior studies showing that stimulation-evoked firing in S1 is sparse (Olshausen and Field 2004; Barth and Poulet 2012; Jouhanneau et al. 2014), even in awake animals with a naturalistic stimulus.
Overall, airpuff deflection of the whiskers generated a modest response in L2/3 Pyr neurons. The peak of the stimulus-evoked Ca2+ signal that we could detect was delayed with respect to the onset of whisker stimulus (∼490 msec after stimulus onset, averaged for the last 3 days of ACC, ACC4–6). The fraction of responsive trials (defined by a change in Ca2+ signal of >2 standard deviation [SD] vs. the baseline signal; see Materials and Methods) across an imaging session did not significantly change during the ACC or SAT periods (mean 28.0% ± 2.6% of responsive trials during ACC4–6 vs. 24.9% ± 2.6% during SAT1–10; n = 27 ± 3 trials on ACC4–6, n = 27 ± 3 on SAT1–10, averaged by animal; Wilcoxon signed-rank test, P = 0.13). Thus, we focused our analyses on responsive trials only.
The mean amplitude for stimulus-evoked responses was 0.44 ± 0.12 ΔF/F0 (animal average during the last 3 days of the pretraining period, n = 9). Notably, this was highly variable across neurons and even for responsive trials in the same neuron. For example, one cell had a mean 0.45 ΔF/F0 peak response for one imaging session, but even within this short window, its evoked activity across trials ranged 15-fold (0.07–1.07 ΔF/F0). Other neurons showed similarly diverse responses across trials, in which the absolute magnitude of the response was lower but trial-to-trial variability was substantial (Supplemental Fig. S3A–C). Because locomotion can impact activity in cortical neurons (Polack et al. 2013; Vinck et al. 2015; Ayaz et al. 2019; Christensen and Pillow 2022), we examined whether variability in response amplitude was linked to gross motor movement, measured in proxy by shifting of the imaging FOV around the stimulus delivery time. To validate this relationship between locomotion speed and pixel displacement, we compared locomotion speed with pixel displacement in a subset of animals (Supplemental Fig. S4A,B). These values show a significant and positive correlation during the animals’ transition from a stationary to a locomoting state (Supplemental Fig. S4C). Therefore, we used pixel displacement within the FOV during the stimulus window as a proxy for locomotion. Using this measure, we did not detect any significant correlation between movement and Ca2+ signals for individual neurons or trials (Supplemental Fig. S5A,B). Importantly, stimulus-evoked movement did not change across imaging days, during either ACC or SAT (Supplemental Fig. S5C–G). Thus, changes in Ca2+ signals are unlikely to be attributed to behavioral habituation and locomotion.
Although experiments were carried out in transgenic mice in which GCaMP6f was similarly expressed in all neocortical Pyr neurons, we also observed marked variation in the mean stimulus-evoked response for different animals within a single FOV (response averaged for a single FOV on ACC6: 1.45 ± 0.52 ΔF/F0 for M6 vs. single FOV 0.097 ± 0.013 ΔF/F0 for M21; mean response averaged across all mice: 0.45 ± 0.15 ΔF/F0). Typically, animals with very high mean response levels maintained these responses, even after several days of exposure to the imaging setup and stimulus. This variation was not clearly linked to the imaging location, which was centered around the D2 barrel (Supplemental Fig. S1B). Sex-dependent differences in the stimulus-evoked response were not apparent (ACC6: males 0.37 ± 0.15 ΔF/F0, n = 5 vs. females 0.55 ± 0.30 ΔF/F0, n = 4; two-sample t-test, P = 0.59).
Direction selectivity of the multiwhisker response
In a subset of animals, we used two different directions of airpuff stimuli—from above (vertical) and also from the front of the animal (horizontal) in the head-fixed position—to characterize and compare the responses of L2/3 Pyr neurons (Fig. 2A,B). The responses of individual neurons to these two stimuli were highly correlated (Fig. 2C, n = 139 cells from four animals; Pearson correlation, slope = 0.91, P = 3.0 × 10⁻³⁴). Despite most neurons exhibiting an evoked response in at least one trial, stimulus-driven activity remained sparsely distributed across the imaged neuron population. To assess whether neurons displayed a directional preference, we identified neurons exhibiting a mean response at least twofold higher to one direction of stimulus compared to the other. The findings indicate that 15.8% of neurons exhibit a preference for vertical stimulus on ACC6, whereas an identical percentage of neurons showed a preference for horizontal stimulus. This result suggests that neurons were not selectively tuned to a single direction using this multiwhisker stimulus.
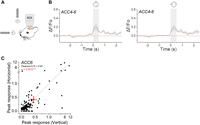
Responses of L2/3 Pyr neurons were not specific to airpuff directions. (A) Schematic of airpuff setup under two-photon calcium imaging. (B, left) Averaged trace of the vertical-airpuff-evoked response during acclimation day 4–6 (ACC4–6). Only responsive trials were included. Trace was averaged across mice. Mean ± SEM of shown in the figure. Gray shaded area indicates the airpuff period. n = 5 mice. (Right) Same as left, but for horizontal-airpuff-evoked responses. (C) Correlation between peak response evoked by vertical and horizontal airpuffs within the same group of cells. Each dot represents one cell. The red dot indicates the mean response (vertical: mean ± SEM = 0.44 ± 0.10, horizontal: 0.43 ± 0.11; n = 139 cells). Pearson's correlation (Pearson's R = 0.81, P = 3.0 × 10⁻³⁴).
Across the population, stimulus-evoked Ca2+ transients were not significantly different in response to the vertical compared to the horizontal stimulus. The mean evoked responses to the vertical stimulus were similar to the horizontal airpuff during the ACC period (Fig. 2C, cell average: ACC6 vertical 0.39 ± 0.15 vs. horizontal 0.38 ± 0.15 ΔF/F0, paired t-test, P = 0.83), consistent with previously published results (Kwon et al. 2017; Kim et al. 2020). We thus elected to use a vertical airpuff stimulus for multiwhisker stimulation during learning, because this generated a robust response in S1BF.
Sensory-association training drives learning
Prior studies from our laboratory and others indicate that sensory training can strengthen excitatory synapses and reduce inhibition onto Pyr neurons in primary sensory cortex (Cooke and Bear 2010; Reed et al. 2011; Audette et al. 2019; Kuljis et al. 2020; Park et al. 2023). To investigate how this would impact Ca2+ signals in an intact cortical circuit, we trained freely moving animals in a simple whisker-dependent reward-association task (Audette et al. 2019; Bernhard et al. 2020), in which a gentle airpuff was linked to a delayed water reward (Fig. 3A,B), with daily imaging sessions to monitor potential changes in stimulus-driven sensory responses (Fig. 3C).
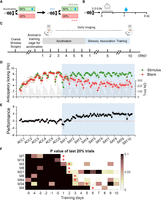
Animal performance progressively improved during SAT. (A) Structure of SAT. (B) Trial structure. A 0.5 sec airpuff was presented after a random delay of 0.2–0.8 sec. Water was delivered after a fixed 0.5 sec delay. Anticipatory licking frequency (Hz) before the water delivery in both stimulus and blank trials was used to calculate the animal's performance. (C) Behavioral and imaging time line. Ten-day SAT started after 6-day ACC. (D) Mean anticipatory licking frequency for stimulus trials (green) and blank trials (red), and mean number of trials per day (gray shaded area). Blue shaded area indicates the training period. (E) Performance was defined as anticipatory lick frequency in stimulus + water trials (Lwater/Lw) minus anticipatory lick frequency in blank trials (Lblank/Lb; see Materials and Methods) averaged across all mice. (F) P values of anticipatory licking frequency of the last 20% of stimulus and blank trials for each animal. Asterisks indicate the learning day (see Materials and Methods: criteria for learning).
Learning was assessed by comparing licking frequency after the predictive stimulus (stimulus trials) compared to trials in which both the stimulus and reward were absent (blank trials; Fig. 3D,E) and was calculated for the last 20% of trials on a given day. All animals showed a significant difference in licking to stimulus versus blank trials during SAT, defined by the P-value of the Wilcoxon signed-rank test <0.05 for two consecutive days. In general, mice learned the task in 2.8 ± 1.7 days, although this varied considerably across individuals, with some animals learning the association after a single day of training and others requiring >5 days (animal M4; see Fig. 3F; Supplemental Fig. S6A–D). These data are consistent with other behavioral training paradigms, in which different animals exhibit divergent learning rates before mastery of the task (Gilad et al. 2018; Aguillon-Rodriguez et al. 2021).
We did not observe any effect of this brief period of stimulation under the 2P microscope on stimulus-associated anticipatory licking behavior when animals were returned to the homecage after imaging (Fig. 3D; Supplemental Fig. S7A–C). Animals did not show a suppression of performance after a given imaging session; indeed, on average there was a modest but not significant increase in performance. Thus, there was no evidence for the extinction of the learned association by the daily imaging sessions.
Stimulus-evoked Ca2+ responses at the onset of training
SAT drives robust changes in synaptic strength, both for higher-order thalamocortical inputs from the posterior–medial nucleus of the thalamus (POm) and also for intracortical connections, particularly at the onset of training (Audette et al. 2019; Kuljis et al. 2020; Ray et al. 2023). Thus, we hypothesized that we would see a significant increase in the stimulus-evoked response, at least in the early stages of SAT.
The evoked response during the initial 3 days of imaging (ACC1–3) exhibited strong heterogeneity, potentially attributable to the animals’ adapting to the head-fixed imaging setup. To better compare responses across different animals, Ca2+ signals were normalized to the mean cellular response in the 3-day window directly before training onset (ACC4–6), when responses appeared to stabilize. At the onset of SAT, we observed a modest, ∼44% increase in the mean sensory-evoked response for L2/3 Pyr neurons across animals on the first day of training compared to the pretraining period (Fig. 4A–C; mean peak within 1 sec at stimulus onset, cell average: ACC4–6 0.47 ± 0.055 ΔF/F0 vs. SAT1 0.88 ± 0.23 ΔF/F0, Wilcoxon signed-rank test, P = 0.078, n = 240 cells; animal average: ACC4–6 0.31 ± 0.13 ΔF/F0 vs. SAT1 0.44 ± 0.21 ΔF/F0, P = 0.20 with one-sample paired t-test, n = 9 animals). This increase in stimulus-evoked response was concentrated in the first two training days and largely resolved by the third day of training, when the majority of animals (7/9) had learned the task. Results were similar when calculated across all trials, not just responsive trials (Supplemental Fig. S8A,B). These data are consistent with our synaptic measurements made in acute brain slices (Audette et al. 2019), and lead us to the hypothesis that increases in evoked activity may be concentrated at the onset of SAT. To test this specific hypothesis, we compare the peak response averaged over all animals between the last 3 days of pretraining (ACC) and the first day of training (SAT1) in Figure 4C. We observed an increase in the response magnitude at this early time point, an increase that was not significant due to substantial variability across animals (one-tailed two-sample t-test, P = 0.063).
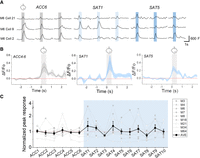
SAT transiently enhanced neural activity in L2/3 Pyr. (A) Example traces of individual vertical-airpuff-evoked responses during acclimation day 4–6 (ACC4–6), SAT day 1 (SAT1), and SAT day 5 (SAT5). F (fluorescence) is reported in arbitrary units. The gray shaded area indicates the duration of airpuff. Only trials that were significantly responsive (peak response > 2 SD baseline) or ∼30% of all stimulus trials, were included in the analysis. (B, left) Significantly responsive activity evoked by vertical airpuff on ACC6. n = 9 mice. (Middle and right) Same as left, but for the averaged traces on SAT1 and SAT5, respectively. Mean ± SEM of shown in the figure. The gray shaded area indicates the duration of airpuff. (C) Mean response to airpuff across the ACC and training period, averaged across mice and normalized to ACC4–6 (black; n = 9 mice). Mean ± SEM of shown in the figure. Gray lines indicate the peak response of individual mice. One-tailed two-sample t-test: ACC4–6 versus SAT1, P = 0.063.
Because locomotion may modulate activity in cortical neurons, we examined how the animal movement might be altered during training, testing whether the modest increase in the mean response of L2/3 Pyr neurons was correlated with an increase in displacement of the imaging FOV. Although we did not record changes in running speed, FOV movement data are likely to capture both locomotion and also more subtle head adjustments. However, we did not observe a change in displacement between the ACC and SAT period, either at the onset of SAT or across the entire imaging period (Supplemental Fig. S9A,B). Overall, Pyr cell responses were uncorrelated with movement (Supplemental Fig. S5A,B), and pixel shifts within the imaging FOV showed no consistent alteration (either increased or decreased; Supplemental Fig. S9A,B) at different stages of training.
Because neurons were imaged under passive stimulation conditions, it is possible that thalamocortical circuitry that processes sensory information was not engaged during imaging in our experimental setup. This is particularly important for higher-order sensory thalamus, which can be regulated by salience and is important during learning (La Terra et al. 2022; Qi et al. 2022). Importantly, synaptic strength at POm inputs onto L2/3 neurons is significantly potentiated by SAT (Audette et al. 2019), informing our predictions about increased Ca2+ signals during SAT. To determine whether POm could be activated by passive whisker stimulation under our imaging conditions, we expressed GCaMP6f in POm afferents and then imaged axonal activity using FOV analysis centered around L1 of S1BF across the training period (Supplemental Fig. S10A,B). In awake, head-fixed animals, the airpuff stimulus used for training activated POm in 77.6% of total trials, driving a significant increase in peak fluorescence upon stimulation (peak response across all stimulus trials vs. baseline on ACC4–6, n = 6 mice averaged by animal; one-sample t-test, P = 0.0016; Supplemental Fig. S10C–F). Thus, the weak effect of SAT on the stimulus-evoked Ca2+ signals in L2/3 Pyr neurons is not easily attributed to a lack of input from higher-order thalamus during passive whisker stimulation.
Stimulus-specific responses in L2/3 Pyr neurons during sensory learning
Animals were trained with a vertical airpuff delivered from above the animal. Because the selectivity of cortical neurons for different sensory stimuli can be enhanced as a result of learning, we hypothesized that neurons might increase their responses to the rewarded direction of the airpuff during training (Ko et al. 2011; Chen et al. 2015; Kim et al. 2020). However, direction-selective responses in S1 have been controversial (Peron et al. 2015; Kwon et al. 2017; Vilarchao et al. 2018) and have not been well-investigated using a multiwhisker stimulus. Our training paradigm provided a test bed to evaluate whether L2/3 Pyr neurons showed enhanced responses to the rewarded stimulus direction.
We compared SAT-initiated changes in stimulus-evoked responses for two directions of multiwhisker stimuli, using randomly interleaved vertical (trained) and horizontal stimuli during imaging in awake mice (Fig. 2B,C; n = 5). Overall, SAT did not appreciably change responses to stimulation with a horizontal airpuff (Supplemental Fig. S11A,B). Responses to the vertical stimulus were modestly larger than responses to the horizontal stimulus during SAT, a difference that was enhanced at the first day of training (Supplemental Fig. S11C–E, cell average: SAT1 vertical 0.86 ± 0.3 vs. horizontal 0.43 ± 0.1 ΔF/F0, P = 0.060; SAT5 vertical 0.43 ± 0.08 vs. horizontal 0.39 ± 0.07, P = 0.59; comparisons by one-sample, two-tailed paired t-test). Although the responses to both directions potentiated during the early training period, the increase appeared proportionally greater for the vertical (trained) response (Supplemental Fig. S11C,E), a difference that was not statistically significant (animal average ACC6 vertical/horizontal response was 3.2% greater vs. SAT1 76.9% greater; paired t-test, P = 0.36; cell average ACC6 vertical/horizontal response was 3.1% greater vs. SAT1 100.0% greater; paired t-test, P = 0.53). This percent change in the vertical response on the first day of SAT was largely due to an increase in the response of a small number of cells. Using the arbitrary criterion of twofold or greater response magnitude for one direction to compare direction preference, 19.4% of neurons exhibited a preference for the vertical stimulus, whereas 13.7% of neurons preferred the horizontal stimulus (n = 240 neurons).
The ratio of the vertical/horizontal response was reduced after extended training (mean ratio by animal, SAT10 vertical was 7.7% greater than horizontal response; mean ratio by cell, SAT10 vertical was 9.5% greater than horizontal). We find a transient increase in responses to the rewarded (vertical) direction at the onset of SAT, a difference that nearly disappeared with extended training.
A small subset of neurons shows enhanced responses at the onset of SAT
Stimulus-evoked activity can be highly heterogeneous across L2/3 Pyr neurons in S1 (Chen et al. 2015; Glazewski and Barth 2015; Pandey et al. 2023), and it is possible that a small subset of neurons showed pronounced changes in response properties during learning that was obscured by averaging population activity. Longitudinal imaging enabled us to compare responses across the same cells during the SAT period (Fig. 5A–L; Supplemental Figs. S12A–C and S13A–F). During the ACC period, mean stimulus-evoked responses averaged across animals were relatively stable, with only small fluctuations in the mean ΔF/F0 for individual cells (Fig. 5A–C), consistent with findings that fosGFP expression remains constant during this time (Lee et al. 2021). We found that 12.1% of neurons showed a twofold or greater increase compared to the prior day during the ACC period (n = 29/240 cells total). For neurons that showed any increase in activity during the ACC period, the mean magnitude of this increase was ∼4.5-fold. At the onset of SAT, 23.8% of cells showed an increase of twofold or greater amplitude compared to the pretraining period (Fig. 5D–F; greater than twofold increase compared to the prior imaging day, ACC4–5 and ACC5–6 mean increase 16.7% vs. ACC6 to SAT1 23.8%; χ2 P = 0.053; n = 240 cells). For neurons that showed an increase on the first day of SAT, the mean magnitude of this increase was 7.2-fold, larger than what was observed across days during the ACC period, a difference that was not significant (two-sample t-test, P = 0.15). Individual neurons did not show a progressive increase in responses during longer periods of SAT (Fig. 5G–L), although some neurons maintained this twofold greater response throughout training (Fig. 5F,I,L; red dots).
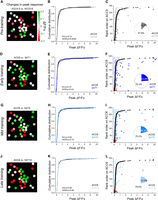
A subset of neurons showed a transient potentiation at training onset: (A) example FOV with cell masks, schematized from the actual image. Color indicates the difference between the corresponding peak responses across significantly responsive trials for individual cells on ACC4–5 and ACC5–6. (B) Cumulative distribution of stimulus-evoked peak response during responsive trials on ACC5 (black curve) and ACC6 (gray curve). Kolmogorov–Smirnov test: P = 0.12; Wilcoxon signed-rank test: P = 0.0030. (C) Mean peak responses of individual cells during responsive trials on ACC6 (gray dots) ranked from the weakest to the strongest based on the mean responses of the same cells on ACC5 (black dots). Each dot represents the stimulus-evoked response of a cell (N = 9 mice; n = 240 cells). Blue dots indicate cells with more than a twofold increase on the later training day in comparison with the earlier training day. Red dots indicate cells with greater than twofold increase consistently across all 3 days of SAT1, 5, and 10. Circles indicate the rest of the cells. Pie chart indicates the percentage of cells showing greater than twofold increase (blue). (D–L) As in A–C, but for cell responses on ACC6 versus SAT1, ACC6 versus SAT5, and ACC6 versus SAT10, respectively. P values of Kolmogorov–Smirnov test and Wilcoxon signed-rank test in figures.
Pseudotraining drives a reduction in stimulus-evoked responses
Were the changes in stimulus-evoked response properties that we observed due to repeated whisker stimulation in the training chamber or to the convergence of stimulus and reward information that underlies associative learning? To maintain a similar number of sensory stimuli but break the contingency so that the stimulus was not a reliable predictor of the reward, we developed a pseudotraining (PSE) paradigm (Audette et al. 2019). Here, whisker stimuli were equally coupled with either a water reward or no outcome. In addition, a subset of trials included water delivery without a preceding sensory stimulus (Fig. 6A). Consistent with the fact that the stimulus was not predictive of the water reward, PSE did not alter stimulus-associated licking behavior (Fig. 6B,C). Pseudotrained animals carried out a similar number of trials as SAT animals (across-day average PSE 135 ± 12 trials n = 5 mice; SAT 148 ± 20 trials, n = 19 mice; one-tailed two-sample t-test, P = 0.37), indicating that the number of airpuff-mediated whisker stimuli in the training cage was not markedly altered by this protocol.
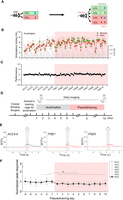
Prolonged PSE reduced the stimulus-evoked response. (A) Structure of PSE. (B) Mean (±SEM) anticipatory licking frequency for stimulus trials (green) and blank trials (red), and mean number of trials per day (gray shaded area). Blue shaded area indicates the training period. (C) Performance (Lstimulus − Lblank; mean ± SEM; see Materials and Methods) averaged across all mice. (D) Behavioral and imaging time line. Ten-day PSE started after 6-day ACC. (E) Significantly responsive activity evoked by vertical airpuff on ACC4–6. Averaged across six mice (mean ± SEM). (Middle and right) same as left, but for the averaged traces on PSE1 and PSE5, respectively. Gray shaded areas indicate the airpuff periods. (F) Peak airpuff-evoked response across the ACC and PSE period, averaged across mice and normalized to ACC4–6 (black, mean ± SEM; n = 6 mice). Gray lines indicate mean cell response for individual mice. One-way repeated measures ANOVA between ACC4–6 and PSE1–10, P = 1.5 × 10⁻⁵.
Animals were imaged daily (Fig. 6D), and the imaging location was similar to SAT animals, centered around the D4 barrel (Supplemental Fig. S14A,B). Stimulus-evoked responses significantly decreased during PSE (Fig. 6E,F; significantly responsive trials only, n = 173 cells in six mice; one-way repeated measures ANOVA between ACC4–6 and PSE1–10, P = 1.5 × 10⁻⁵). This reduction was maintained throughout the 10 day training interval. We observed no change in the mean fraction of responsive cells within an animal, across the PSE period, and analysis of all trials (not just responsive trials) showed a similar significant reduction in evoked responses (Supplemental Fig. S15A,B).
Longitudinal imaging of the same cells each day enabled us to compare responses across the same cells during the PSE period (Fig. 7A–L). Multiple days of PSE were linked to a significant reduction in the evoked response for individual neurons (i.e., a leftward shift) that was sustained at intermediate and prolonged PSE periods (Fig. 7I,L; Supplemental Fig. S16A–F; compare to Fig. 5I,L). This contrasts with the increase in responses for individual neurons (i.e., a rightward shift) after SAT, particularly for the first training day (Fig. 5D–F). The difference between PSE and SAT was also reflected in the fraction of neurons that showed a greater than or equal to twofold increase in the airpuff-evoked response. This population increased after the first day of SAT compared to the baseline period but did not change for PSE compared to the control period for those animals (PSE–ACC 16.2% vs. 17.9% for PSE1; χ2 P = 0.68).
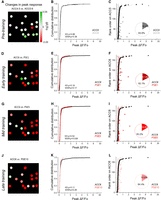
Pseudotraining suppressed stimulus-evoked responses in individual neurons: (A) example FOV with cell masks. Color indicates the difference between the corresponding peak responses across responsive trials for individual cells on ACC4–5 and ACC5–6. (B) Cumulative distribution of stimulus-evoked peak response across responsive trials on ACC5 (black curve) and ACC6 (gray curve). Kolmogorov–Smirnov test: P = 0.86; Wilcoxon signed-rank test: P = 0.38. (C) Mean peak responses of individual cells on ACC6 (gray dots) ranked from the weakest to the strongest based on the mean responses of the same cells across responsive trials on ACC5 (black dots). Each dot represents the stimulus-evoked response of a cell (N = 6 mice; n = 173 cells). Dots indicate cells with more than a twofold increase on the later training day in comparison with the earlier training day. Circles indicate the rest of the cells. Pie chart indicates the percentage of cells showing greater than twofold increase (blue). (D–L) As in A–C, but for cell responses on ACC6 versus PSE1, ACC6 versus PSE5, and ACC6 versus PSE10, respectively. Red dots indicate the same cells with greater than twofold increase on PSE1, 5, and 10. P values of Kolmogorov–Smirnov test and Wilcoxon signed-rank test in figures.
Learning behavior is correlated with reduced sensory-evoked activity in S1
Because animals were imaged daily as they learned the task, and individual animals showed heterogeneous rates of learning (Fig. 3F; Supplemental Fig. S6A–D), we could examine how performance and stimulus-evoked activity covaried across the training interval for across a large cohort of SAT and pseudotrained mice.
The training-dependent reduction in stimulus-evoked activity observed in animals undergoing SAT was strongly correlated with improved animal performance in the task. As animals learned to differentiate between stimulus and blank trials (revealed by greater licking in stimulus trials), there was a significant negative correlation between stimulus-evoked activity and performance in the task over all training days (Fig. 8A; slope = −0.015, Pearson's R = −0.23, P = 0.040 compared to ACC period, Fig. 8B). Note that we did not detect an overall reduction in evoked activity during the later stages of SAT, just the renormalization to baseline levels of responsiveness. Because pseudotrained animals did not change their licking behavior in response to the stimulus (Fig. 6B), we could not accurately assess any activity and behavioral correlations for this group (Supplemental Fig. S17A, compare to ACC period Supplemental Fig. S17B). Overall, these data suggest that the renormalization in the responses in Pyr neurons from S1 does not impair the differentiation of stimulus from blank trials during learning.
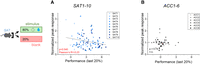
Renormalization of stimulus-evoked responses correlated with the improvement in animal performance during SAT. (A) Correlation between the performance of the last 20% of trials and the stimulus-evoked response across responsive trials (normalized to ACC4–6). Colors indicate different training days. Each dot represents an animal in 1 day. Pearson's correlation: R = −0.32, P = 0.040. N = 9 mice, n = 240 cells. (B) Same as A, but for 6-day ACC. Pearson's correlation: R = −0.048, P = 0.74.
Discussion
Sensory learning has been shown to drive changes in synaptic structure and function, but the connection between these substrates and the alteration of network activity has remained unclear. We took advantage of documented input- and target-specific plasticity evoked by a well-characterized whisker-dependent sensory-association learning task to investigate changes in stimulus-evoked activity, using longitudinal in vivo imaging in mouse S1BF. We find that whisker-dependent activation of L2/3 Pyr neurons may be increased at the earliest stages of training, but that these changes renormalize as animals learn the association. Importantly, sensory association without coupled reward did not show the same effects, suggesting that highly predictive stimulus–outcome relationships may drive a unique program of cortical plasticity.
Imaging outside of behavioral context
We elected to image neural responses in head-fixed animals that had been trained under freely moving conditions for several reasons. First, the use of water deprivation to motivate behavior can generate a variety of motivational states (urgency, satiety) as the animal performs the task within a limited time window, complicating data analysis (Ramesh et al. 2018). Second, imaging during task-related behaviors conflates expectation- and reward-related signals with sensory-evoked activity. Finally, because the synaptic changes we had previously characterized were present in acute brain slices as well as fixed tissue (Audette et al. 2019; Ray et al. 2023), we reasoned that they should be apparent under passive stimulation conditions. Importantly, we established that multiwhisker stimulation under our head-fixed conditions was sufficient to engage higher-order POm thalamus, a well-documented site of synaptic change (Audette et al. 2019; Ray et al. 2023). Thus, the modest changes in Pyr cell activity observed during our imaging conditions could not be ascribed to the absence of POm activation.
Broad, subthreshold changes in synaptic input may not be sufficient to drive robust increases in stimulus-evoked spiking in L2/3 neurons, particularly outside of the task context. It remains possible that task engagement—in which neuromodulatory circuits can be dynamically activated—might have amplified some of the synaptic changes characterized in vitro or in fixed tissue, increasing neural response properties that could be detected by Ca2+ imaging. Indeed, a direct comparison between passive- and task-engaged sensory-evoked activity suggests that passive stimulation may be less effective at driving excitation in L2/3 Pyr neurons in vivo, at least in well-trained animals (Kato et al. 2015). However, because POm-evoked firing can be detected in acute brain slices after training (in which neuromodulatory systems are not expected to be active; Audette et al. 2019), it is unlikely that task-engaged factors such as the release of neuromodulators are required to reveal response potentiation, although they could enhance the effect of synaptic changes. However, state-dependent effects on cortical inhibition in awake animals may have occurred that mitigate the responses observed in this study. In addition, although GCaMP6f is a sensitive indicator of firing activity (Chen et al. 2013), it is not optimized to detect isolated spikes, which commonly occur in S1 where evoked activity in superficial layers is notably sparse (Barth and Poulet 2012). Thus, it is possible that SAT drove an increase in the activity of L2/3 Pyr neurons that could not be detected under our experimental conditions.
One limitation of our study is that whisking activity was not directly measured to correlate with Pyr cell activity in L2/3. Our prior studies indicate that the airpuff itself might initiate whisking in head-fixed animals (Bernhard et al. 2020), which could conceivably alter neural responses. Indeed, whisking can modulate the activity of Pyr neurons in S1BF; however, the fraction of whisking-modulated cells in L2/3 is small, only 3%–5% of all Pyr cells (O'Connor et al. 2010; Ayaz et al. 2019; Kim et al. 2020). We thus expect that the impact of whisking on evoked responses will be minimal. If SAT is linked to increased whisking activity, it is possible that the small increase in stimulus-evoked activity of Pyr neurons observed during early training might be attributed to this behavioral variable or even others, including altered locomotion. However, even using the stimulus-associated shift in FOV displacement—an admittedly crude measurement of movement—most animals did not show an increase in this measure during SAT (Supplemental Fig. S9A,B) and Pyr cell response magnitude showed no clear correlation with this detected movement (Supplemental Fig. S5A,B).
Sensory-evoked responses and learning are not suppressed by daily imaging
It is possible that the daily imaging sessions that involved whisker stimulation could extinguish the learned association or drive a general reduction in evoked responses of L2/3 Pyr neurons by habituation. We think that this was not the case. First, animals in the present study learned at approximately the same rate as in other studies using this behavioral paradigm (Audette et al. 2019; Bernhard et al. 2020; Lee et al. 2021; Ray et al. 2023). Second, a direct comparison of animal performance before and after imaging sessions did not show any evidence for impaired performance (Supplemental Fig. S7A–C). Because the imaging context under the 2P microscope was markedly distinct from the homecage training setup, it is likely that animals could differentiate these two conditions. It is also worth noting that animals used their whiskers continuously throughout the day in this freely moving training paradigm, and that these incidental movements (as well as experimenter handling of mice) might also conceivably extinguish the association. This is not the case. Indeed, it is remarkable that in our freely moving training paradigm, comparatively brief epochs of training—300 or so trials that last <4 sec each, distributed across a 24 h window—are sufficient to drive changes in neural responses in S1BF.
Furthermore, we did not observe evidence for response habituation (Supplemental Fig. S2A) during an imaging session, and evoked responses were stable during the pretraining window, when animals were housed in the training cage without paired stimulus–reward delivery (Supplemental Fig. S2B–E). Thus, we conclude that response habituation and extinction of learned responses are unlikely to contribute to the findings described here.
Plasticity in primary sensory cortex may be transient, despite learning
We took advantage of longitudinal imaging to track individual neurons and directly compare their responses across days of training. In general, responses were highly variable both within and across neurons even within a training day, although we could identify neurons with a tendency toward higher or lower activity at any given time point. We were able to detect a small subset of cells that showed an increase in stimulus-evoked activity compared to the pretraining cage ACC period, particularly at the onset of learning. This was distinct from what was observed during PSE despite a similar number of stimulus trials, indicating that it was not dependent on exposure to the airpuff in the training environment.
Although it is tempting to speculate that these cells might be distinguished by expression of the immediate-early gene c-fos, prior imaging studies indicate that the expression of a fosGFP reporter is not altered by SAT (Lee et al. 2021). Furthermore, whole-cell patch clamp recording studies indicate that thalamocortical synaptic plasticity may be anticorrelated with fosGFP expression (Lee et al. 2021). Evoked activity across L2/3 Pyr neurons is diverse and fluctuates over time (Elstrott et al. 2014), and it will be of interest to identify potential anatomical or molecular markers that might distinguish neurons that show a more marked increased stimulus-evoked Ca2+ activity at the onset of training (see e.g., Condylis et al. 2022).
In general, the increase in activity for individual neurons was not sustained across days, in which <3% of neurons that exhibited increased stimulus-evoked activity maintained this increase for longer training intervals. Prior studies using head-fixed training paradigms in both somatosensory and other sensory modalities have identified an increase in stimulus-evoked activity in primary sensory cortex with training. However, these changes have been generally subtle (Gilad and Helmchen 2020), shifting the selectivity of neurons to the trained stimulus (Poort et al. 2015), the fraction of responsive neurons (Gdalyahu et al. 2012), the mean “event rate” of evoked responses (Rabinovich et al. 2022), or the tuning of neurons defined by projection target (Chen et al. 2015). In almost all cases, analysis has focused on expert animals (but see Makino and Komiyama 2015), in which our data and that from other laboratories suggest that changes may be less pronounced (Reed et al. 2011; Jurjut et al. 2017).
Importantly, our study focused on L2/3 Pyr neurons, and it remains possible that there are longer-term changes in the response properties of other neurons across the cortical column, including diverse interneurons or neurons in L5, that may be revealed during the task (Chen et al. 2015; Lacefield et al. 2019).
It is possible that the enhancement of sensory signals during the initial stages of training may facilitate the association of candidate sensory cues to drive learning. Later, as discrete sensory cues are established as having strong predictive value to trial outcome (i.e., water reward), neural signals that had initiated this potentiation are reduced and neural activity as well as synaptic strength renormalize to baseline levels. This hypothesis is consistent with contemporary models of predictive coding and inference (Bastos et al. 2012).
Stimulus-specific potentiation
Both directions of whisker stimulation showed enhanced responses to passive whisker stimulation at the early stages of learning, suggesting that neural ensembles representing the paired stimulus–reward direction are not selectively modified. Although the training task took place in freely moving animals so that stimulus direction could not be precisely controlled during training, it is unlikely that animals ever received a horizontal stimulus coupled to the water reward, yet responses to horizontal airpuff were similarly enhanced at the onset of training.
We note that mice can readily learn to discriminate different directions of whisker stimulation in this freely moving task (Bernhard et al. 2020); the neural substrates for this selectivity may lie outside of superficial layers of S1. In addition, directional tuning of neurons in S1 has classically been characterized using single-whisker stimuli (Andermann and Moore 2006; Vilarchao et al. 2018); it is possible that the more complex multiwhisker stimulus cannot capture small differences in the direction preference of individual neurons. Overall, we find that response potentiation is not restricted to a direction-specific ensemble in superficial layers of S1 using a naturalistic, multiwhisker stimulus. These findings are consistent with training-related signals that are broadly transmitted across L2/3 Pyr neurons, not to a feature-selective subset of cells.
Pseudotraining suppresses sensory-evoked activity
Our data indicate that stimulus presentation without coupled rewards drives a markedly different response in L2/3 Pyr neurons as animals are exposed to the training environment. In contrast to an initial increase in cellular activity observed in animals exposed to SAT, PSE did not increase the response properties of Pyr neurons, either in the mean amplitude of the stimulus-evoked response, the number of responsive neurons, or in the fraction of responsive trials. Indeed, PSE was associated with suppression of the stimulus-evoked response that was maintained over time (summarized in Supplemental Fig. S18A–D). Importantly, there was no difference in the absolute number of stimulus trials for animals in our two experimental groups. Thus, the critical difference between these two conditions lies within the link between the stimulus and the highly reliable delivery of water through the lickport, where the stimulus is perfectly predictive for SAT but irrelevant during PSE. In this way, PSE may be distinctly different from repeated passive exposure to a sensory stimulus that can increase neural responses (Cooke and Bear 2010; Gambino et al. 2014; Miller et al. 2022). However, other studies suggest that passive exposure to a sensory stimulus may decrease sensory-evoked activity (Kato et al. 2015; Makino and Komiyama 2015; Henschke et al. 2020; Gao et al. 2021). Thus, the specific experimental conditions used for passive sensory stimulation may play a critical role in determining the outcome on cortical circuits.
Sensory-induced plasticity has been studied using exposure to sensory stimuli without any outcome (sensory only), exposure to sensory cues that are fully predictive of reinforcers, and sensory cues that are explicitly decoupled from reinforcers. One critical difference between our PSE paradigm and passive exposure to sensory input is that PSE involved an intermittent reward but passive exposure experiments typically have no outcome (see, e.g., Gambino et al. 2014; Cooke et al. 2015; Gao et al. 2021). We hypothesize that the brain may be sensitized by the presence of reinforcement information to infer causal interactions between the stimulus and reward, even when these interactions are not present. Indeed, reinforcement information can potently engage neocortical circuits (Pleger et al. 2009; Szadai et al. 2022; Ramamurthy et al. 2023), and repeated exposure to reinforcers in the absence of learning is sufficient to drive plasticity in different cortical regions (Jasinska et al. 2010; Gdalyahu et al. 2012).
Notably, in our experiments PSE drove a significant suppression of stimulus-evoked activity in barrel cortex. These data suggest that when sensory information is not correlated with behaviorally significant outcomes, sensory information may slowly be devalued, reducing stimulus-evoked firing. In contrast, the strong predictive power of the multiwhisker stimulus during SAT may activate selective pathways (such as feedback or neuromodulatory inputs) that first enhance and then maintain stimulus-related representations in S1. This differential effect on neural activity between PSE and SAT underscores the importance of task structure in engaging plasticity mechanisms that alter sensory processing in the cortex. Although predictive coding in neocortical circuits has been the subject of intense investigation (Bastos et al. 2012; Keller and Mrsic-Flogel 2018), the way that prediction accuracy can initiate long-lasting plasticity mechanisms has not been well-explored.
Conclusion
Longitudinal imaging using genetically encoded Ca2+ indicators facilitates a detailed comparison of neuronal response properties across time and training conditions. We took advantage of this preparation to test the hypothesis that synaptic changes linked to association learning would be correlated with an increase in evoked activity of L2/3 Pyr neurons. We identified a small and transient increase in stimulus-evoked activity, dominated by a subset of neurons that appeared to renormalize with time as animals learned to associate a multiwhisker stimulus with a water reward. As discriminative behavior—measured by an increase in anticipatory licking to the stimulus—improved, stimulus-evoked activity returned to pretraining levels.
This correlation between performance and stimulus-evoked activity during SAT was highly significant, suggesting that enhancement of sensory representations in barrel cortex is not required to encode associations once learned. These data are consistent with prior studies using extracellular recordings in auditory cortex, where learning is maintained despite renormalization of activity in A1 (Reed et al. 2011), and other studies that identify molecular mechanisms for resolving synaptic potentiation after in vivo experience (Clem et al. 2008). Notably, experience-dependent synaptic potentiation that is pronounced at early training stages resolves as animals master the task (Ray et al. 2023). We propose that broad-scale, learning-related plasticity—both in synaptic strength and neural activity—in primary sensory cortex may facilitate modifications at downstream brain areas that are required for learning (Barth and Ray 2019). The circuit-level mechanisms that initiate and then resolve this experience-dependent synaptic plasticity will be of great interest.
Materials and Methods
Animals
For GCaMP6f imaging in excitatory (Vglut1-expressing) neurons, we crossed Slc17a7-IRES2-Cre-D mice (Jackson 023527) or Emx1-Cre (Jackson 005628) mice to Ai93(TITL-GCaMP6f)-D; CaMK2a-tTA mice (Jackson 024108) (Steinmetz et al. 2017). The Emx1-Cre; Camk2a-tTA; Ai93 mice were treated with doxycycline until weaning to prevent interictal events. Juvenile to adult transgenic mice (1.5–6 months of age) were used for cranial window surgery and recovered for 1–3 weeks before commencing 2P in vivo imaging.
Cranial window surgery
Surgery was done under isoflurane anesthesia (4% for induction, 1.5%–2% for maintenance). Mouse was put on a heat pad with a temperature control system (FHC 40-90-8D) to maintain body temperature. Dexamethasone (2 mg/kg) was injected subcutaneously right before surgery to reduce brain swelling and/or inflammation. Eyes were covered with Puralube Vet Ointment to protect them from drying. Fur was removed with Nair, and the skin was cleaned with povidone and then cut out to expose the skull. The skull was scraped with a dental blade (Salvin 6900) to remove the periosteum and abraid the surface for headpost attachment. On the left hemisphere, S1 coordinates (3.5 mm lateral, 1 mm posterior to bregma) and a 3 mm diameter circle centered at the coordinates were marked with a pen. A thin layer of tissue adhesive (3M VetBond) was applied to the skull, then a custom-made headpost was attached to the right hemisphere with cyanoacrylate glue and dental cement (Lang Dental 1223PNK). With a dental drill (Dentsply 780044), the skull was thinned along the 3 mm diameter circle. Thinned skull was removed by lifting a spot of the thinned region with forceps. Minor bleeding was stopped with saline-soaked gelfoam (Pfizer 00009032301), and a glass window comprised of a 3 mm diameter glass (Warner Instruments 64-0726) attached to a 4 mm diameter glass (Warner Instruments 64-0724) by UV adhesive (Norland 717106) was applied over the craniotomy. The window was sealed with 3M Vetbond and then cyanoacrylate glue. All exposed skull area except the window was covered with dental cement. A well surrounding the window was built with dental cement for microscopy using a water immersion lens. At the end of the surgery, ketoprofen (3 mg/kg) was injected subcutaneously, and the mouse was allowed to recover in a heated cage. Mice were given 1–3 weeks of recovery before imaging commenced.
Viral injection
For GCaMP6f imaging in POm axons, we injected pAAV1.Syn.GCaMP6f.WPRE.SV40 (Addgene 100837) in C57BL6 (Jackson 000664) and Sst-Cre (Jackson 013044) mice using a disposable metal cannula attached to an RWD 462 syringe pump, directly before application of the cranial window. Before craniotomy and window implant, a total of ∼0.4 µL of virus (∼1.84 × 10¹³ vg/mL) was injected into POm (1.1 mm lateral, 1.9 mm posterior to bregma, 3.3 mm below the pial surface).
Behavioral training (SAT)
Mice were trained to associate a multiwhisker stimulus with a delayed water reward in an automated training homecage (Bernhard et al. 2020). Briefly, mice were single-housed in a homecage connected to a freely accessible chamber with a water port and an airpuff delivery tube. Animals were not water-deprived. During the cage ACC period, animals could freely approach the lickport where a water droplet (∼10 µL) was dispensed at 80% probability (i.e., 20% of nosepokes did not result in water delivery). For the SAT group, water delivery was preceded by a gentle airpuff (6 psi, 500 msec duration) to the right-side whiskers 500 msec before (see Fig. 1 for schematic). This sensory cue was fully predictive; that is, all airpuff stimuli were followed by water. During SAT, 80% of trials consistent of the predictive airpuff followed by the water reward. The remaining 20% of trials had no stimulus and no water reward (blank trials). There was a 2 sec timeout between trials, when nosepokes would not trigger water delivery.
All imaged animals went through 6 days of ACC and then 10 days of training. For each animal, total number of trials (water + blank trials) and anticipatory lick frequencies (licks occurring in a 300 msec window right before water delivery; see Bernhard et al. 2020) were calculated for every 4 h bin using custom MATLAB codes. Any 4 h bin with fewer than 10 trials was removed from the averaged data, because lick frequency to blank trials could not be accurately assessed from one to two trials. A Wilcoxon signed-rank test was used to evaluate absolute differences in calculated lick frequency between stimulus and blank trials for the last 20% of trials every day for animals within an experimental group to determine whether animals had adjusted anticipatory licking to reflect learning. If the P-value of the Wilcoxon signed-rank test was <0.05 for two consecutive days, we considered that first day as the day of learning.
Pseudotraining
Pseudotraining was designed to eliminate the predictive power of the stimulus on the reward outcome. During the ACC days before PSE, water was delivered with a 50% probability to match the overall probability of water dispersion during this training paradigm. During PSE, airpuff was delivered in 80% of the trials but water followed the stimulus for only half the trials. To further decouple the stimulus from the reward, water was delivered without a preceding airpuff for half of the remaining (blank) trials. Therefore, the airpuff stimulus and water reward were entirely uncoupled during PSE. Mice went through 6 days of ACC and then 10 days of PSE. Animal performance was calculated as described for SAT.
2P in vivo imaging
Awake head-fixed calcium imaging
All training sessions were conducted within the automated homecage training system, ensuring a consistent and controlled environment for behavioral learning tasks. However, mice were removed from their homecage environment for brief periods of 1 h/day, typically around noon, for imaging sessions conducted outside the behavioral context. We used a 2P microscope setup by Femtonics (Femto2D Galvo), equipped with a Mai Tai laser MTEV HP 1040S (Spectra-Physics), a 4× air objective lens (Olympus UPLFLN 4X NA 0.13), and a 40× water objective lens (Olympus LUMPLFLN 40XW NA 0.8). Images were acquired with MES software v.6.1.4306 (Femtonics). For awake imaging, the mouse was removed from the training cage around noon each day, briefly anesthetized with volatile isofluorane to headfix the animal under the microscope, and then allowed to recover for 3–5 min before imaging. Animals were awake and ambulatory on the wheel before imaging began. Imaging depth was ∼200 µm below pia (L2/3), and one to two fields were imaged per mouse. For animals in which more than one FOV was imaged (n = 4 for SAT and n = 5 for PSE), we did not observe a systematic reduction in neural responses in the second FOV. After the imaging session, typically lasting for 1 h, the mouse was promptly returned to the sensory training cage.
For awake imaging, the mouse was briefly anesthetized (4%) for ∼20 sec and then head-fixed under the microscope on a wheel that allowed only forward or backward running. Blood vessel morphology in 4× brightfield was used to find the same imaging spot as the previous session. The pial surface (Z = 0) was defined as the plane right below the dura matter that looks like a textured membrane in 40× brightfield. In 40× 2P mode, the X, Y, Z positions of the neurons were aligned to match the previous session image. A 950 nm excitation was used to image GCaMP6f signals, and emission fluorescence was detected with photomultiplier tube (PMT; Hamamatsu H11706P-40). Laser power and PMT voltage were kept constant for each animal across its imaging sessions. Images were acquired at 5.11 Hz with ∼270 µm × 300 µm FOV and 0.7 µm/pixel resolution. Imaging depth was ∼200 µm below pia (L2/3), and one to two fields were imaged per mouse.
A total of nine mice were included in the SAT group. For each day, ∼3–5 min after head fixation, two 10 min imaging sessions were carried out, with a 1 min break in between. At the beginning of each imaging session, spontaneous activity before sensory stimuli was recorded over a 50 sec window. For four out of nine mice in the SAT group, we obtained responses to either a vertical airpuff (500 msec duration, 6 psi) or blank (solenoid click) delivered by Arduino every 20 sec (0.05 Hz) to the right-side whiskers during each session. Airpuff and blank stimuli had an equal probability of occurring and were randomly interleaved. Approximately 20 total airpuffs were delivered during the two 10 min sessions. For the other five mice in the SAT group, we interleaved vertical and horizontal airpuff (500 msec duration, 6 psi), and other conditions remained unchanged. A total of six mice were included in the PSE group, and all mice received only vertical airpuff randomly interleaved among blank trials during imaging. Following the imaging sessions, mice were promptly returned to their homecage environment to minimize disruption to their daily routine and ensure the stability of their behavioral training regimen.
After animal training and when all imaging sessions were completed, the head bracket and window were removed and the imaging site was marked by marking the site with a glass micropipette containing methylene blue dye. Brains were fixed in 4% paraformaldehyde and sectioned either coronally or flattened and cut tangentially to confirm the imaging site location.
Image analysis
Calcium imaging
An imaging file containing all imaging sessions (∼96,000 frames) was aligned and segmented with Suite2P (Pachitariu et al. 2016). The output from Suite2P included all possible segments. ROIs were manually selected from all segments based on morphology and fluorescence traces calculated by Suite2P. Individual ROIs (neurons) were tracked across each imaging day, and neurons that could not be tracked across all days were discarded from the analysis.
Image movement was assessed by calculating shifts in aligned pixels across frames, extracted from Suite2P. As images were captured using FOVs of two different dimensions, ∼300 × 300 pixels and 300 × 200 pixels, we established that any frame that shifted more than 35 pixels in either the X or Y direction within the larger FOV or more than 20 pixels in either direction within the smaller FOV was considered a shifted frame. One or two continuously shifted frames were interpolated with the average value of the previous and the next unshifted frames (both fluorescence signal and pixel shift). When more than three consecutive frames were shifted within a single trial, the trial was then removed.
Raw fluorescence was extracted for each segmented ROI, and fluorescence signals were neuropil-corrected (Fcorrected = FROI − 0.7 × Fneuropil) to remove a contribution from excitatory neurons in other layers (Chen et al. 2013). Baseline fluorescence (F0) was calculated by averaging the neuropil-corrected signal (Fcorrected) within a 3 sec time window preceding the stimulus onset of individual trials. The change in fluorescence relative to baseline, ΔF/F0, was computed for every single trial by subtracting F0 from Fcorrected and then dividing by F0. The neuropil-corrected ROIs were considered as neurons.
Responsive neurons were determined on each day, including both ACC and training days using the following criteria. Peak response was defined by the maximum amplitude during the 1 sec window after the airpuff onset (five image frames). Neurons were scored as responsive in a given trial if the peak ΔF/F0 > 2 SD, where SD was calculated using the 3 sec window before the airpuff onset. The daily stimulus-evoked activity of each responsive neuron was calculated by averaging the cell response across all responsive stimulus trials within each imaging day. The peak response from ACC4–6 was used to normalize responses from the SAT period (Figs. 4C and 6F; Supplemental Figs. S8B, S9A, S11B, S15B, and S18A) because neural activity during the first three imaging days showed greater variability than subsequent days of imaging in the pretraining period.
For POm activation, a FOV was used for analysis because axons were small and could easily move in and out of the imaging plane across trials. Four FOVs were collected per animal.
Locomotion analysis
A rotary encoder of 600 pulses per second (Taiss KY-040 rotary encoder) was used to record locomotion speed during calcium
imaging in a small cohort of animals. The collected data were down sampled to 20 Hz. Because we detected a significant positive
correlation between locomotion and pixel displacement (Supplemental Fig. S4C), we used pixel displacement as a proxy for animal movement. This measure encompassed not only running activity but also
other forms of locomotor behavior, such as grooming. The changes in pixel location in the X and Y directions, represented by Px and Py, were calculated and extracted from Suite2P in images with a transverse resolution of 0.81 μm per pixel. The relative pixel
displacement of individual imaging frames was calculated using the equation  . The absolute pixel displacement, defined as the difference in pixel positions between consecutive frames, was calculated
as Pxy(n + 1) − Pxy(n), where n represents the sequence of a frame. The average pixel shift during the 1 sec response window in all stimulus trials was calculated
for individual days and plotted across 16 imaging days. The mean pixel shift during 6 day ACC and the mean pixel shift during
10 day training were compared using two-tailed paired t-test. We did not observe any significant change in the pixel displacement of the imaging window during training, a measurement
that takes into account both locomotor and other movements, data that is presented in Supplemental Figure S9A,B. We also did not observe a consistent difference—either an increase or decrease in the evoked response—for large versus small
pixel displacements (Supplemental Fig. S5A,B). Taken together, our data do not support a strong role for locomotion in modulating S1 Pyr neuron responses. Indeed, there
is no consensus on whether sensory-evoked responses in S1BF are enhanced (Ayaz et al. 2019) or suppressed (Shimaoka et al. 2018) by locomotion.
. The absolute pixel displacement, defined as the difference in pixel positions between consecutive frames, was calculated
as Pxy(n + 1) − Pxy(n), where n represents the sequence of a frame. The average pixel shift during the 1 sec response window in all stimulus trials was calculated
for individual days and plotted across 16 imaging days. The mean pixel shift during 6 day ACC and the mean pixel shift during
10 day training were compared using two-tailed paired t-test. We did not observe any significant change in the pixel displacement of the imaging window during training, a measurement
that takes into account both locomotor and other movements, data that is presented in Supplemental Figure S9A,B. We also did not observe a consistent difference—either an increase or decrease in the evoked response—for large versus small
pixel displacements (Supplemental Fig. S5A,B). Taken together, our data do not support a strong role for locomotion in modulating S1 Pyr neuron responses. Indeed, there
is no consensus on whether sensory-evoked responses in S1BF are enhanced (Ayaz et al. 2019) or suppressed (Shimaoka et al. 2018) by locomotion.
Analysis of stimulus-evoked response habituation
For each imaging day during the cage ACC period, the peak responses of all cells across all trials were plotted in chronological trial order. A linear function was fitted through the peak response for each cell, to determine whether evoked responses showed a trend to increase or decrease with trial number. The mean slopes of these trend lines were plotted and compared by cells and by animals at ACC1 and ACC4 using a two-tailed paired t-test.
Statistical analysis
Evoked responses were compared across cells or animals, indicated in specific comparisons and figures. In general, we used a paired t-test for direct comparisons between cells and animals over specific days, a paired t-test for analysis of stimulus versus prestimulus POm axonal activity, and a χ2 test for changes in the fraction of cells grouped by selected experimental criterion. In Figure 4C, we used a one-tailed two-sample t-test for comparison of peak evoked responses between ACC4–6 and SAT1 because we hypothesized that SAT would drive an increase in the stimulus-evoked response, based on our prior studies in our laboratory (Audette et al. 2019). In Figure 6F, we used one-way repeated measures ANOVA to assess the difference between ACC4–6 and the PSE data set. When investigating whether pseudotrained animals conducted a comparable number of trials to SAT animals, we also used a one-tailed two-sample t-test. This decision was based on our hypothesis that PSE mice would execute more trials than SAT mice, attributed to the lower water probability. Cumulative distributions of cell responses were compared using a Komolgorov–Smirnov test and also a Wilcoxin-rank sum test for comparison of specific cell responses across days (i.e., in Figs. 5B,E,H,K, 7B,E,H,K; Supplemental Figs. S13B,E and S16B,E).
Acknowledgments
Special thanks are due to Joanne Steinmiller for expert animal care, Jiseok Lee for experimental assistance at the onset of the experiments, Sarah Bernhard for technical support with the training code, Xiaoyang Ma for assistance with locomotion analysis, and members of the Barth laboratory for helpful comments on the manuscript. This work was supported by National Institutes of Health (NIH) grants R21 NS127354 and R01 NS123711 and Air Force Office of Scientific Research (AFOSR) grant FA9550-20-1-0134 to A.L.B., NIH grant R01EY034644 to S.J.K., and a Stupakoff Research Enrichment award to M.Z.
Footnotes
-
[Supplemental material is available for this article.]
-
Article is online at http://www.learnmem.org/cgi/doi/10.1101/lm.053870.123.
-
Freely available online through the Learning & Memory Open Access option.
- Received September 15, 2023.
- Accepted May 7, 2024.
This article, published in Learning & Memory, is available under a Creative Commons License (Attribution-NonCommercial 4.0 International), as described at http://creativecommons.org/licenses/by-nc/4.0/.



