


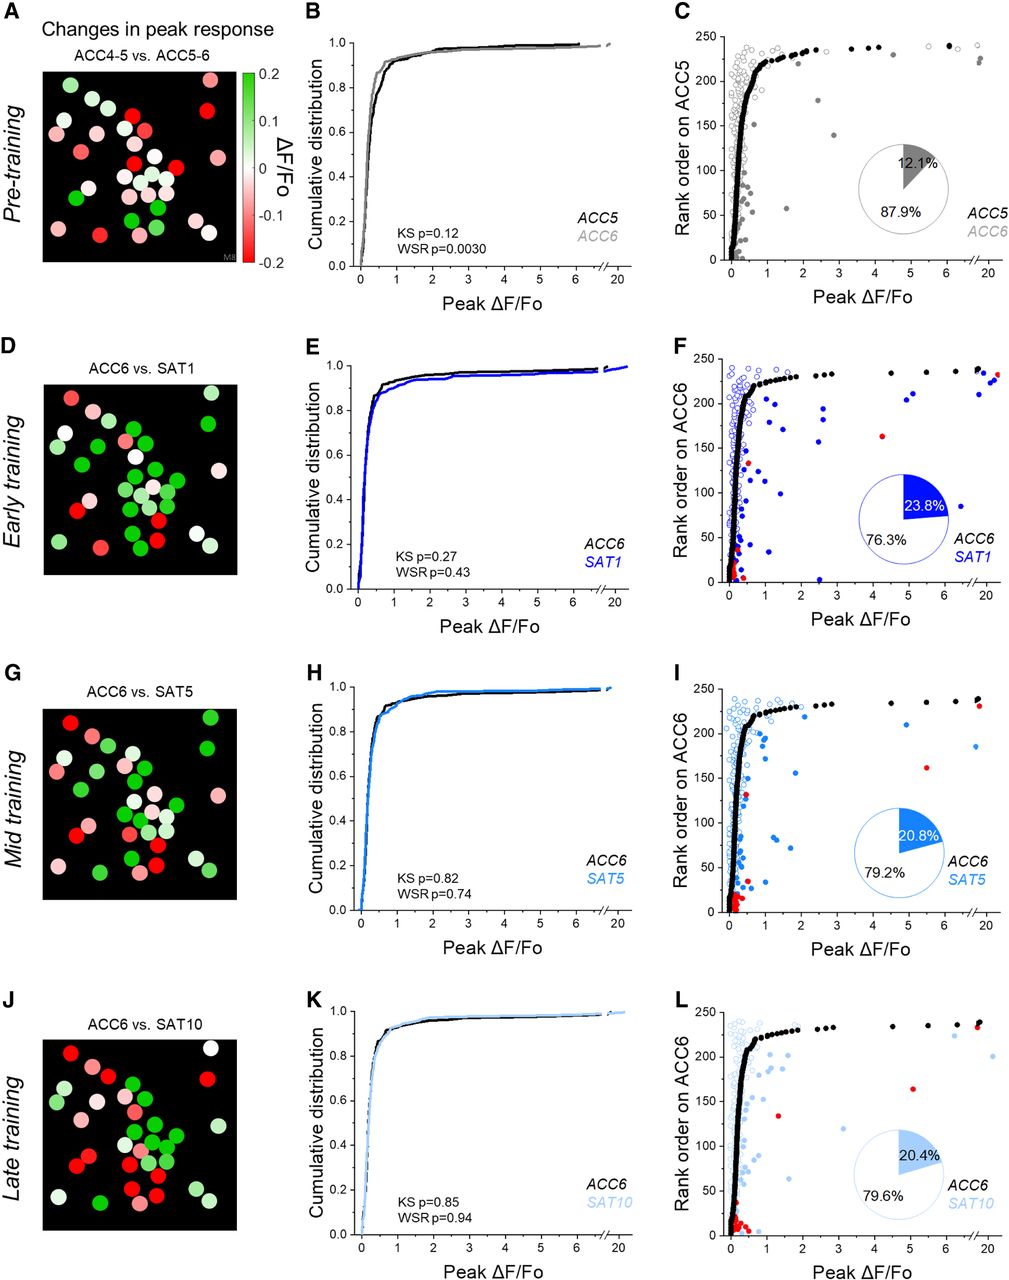
A subset of neurons showed a transient potentiation at training onset: (A) example FOV with cell masks, schematized from the actual image. Color indicates the difference between the corresponding peak responses across significantly responsive trials for individual cells on ACC4–5 and ACC5–6. (B) Cumulative distribution of stimulus-evoked peak response during responsive trials on ACC5 (black curve) and ACC6 (gray curve). Kolmogorov–Smirnov test: P = 0.12; Wilcoxon signed-rank test: P = 0.0030. (C) Mean peak responses of individual cells during responsive trials on ACC6 (gray dots) ranked from the weakest to the strongest based on the mean responses of the same cells on ACC5 (black dots). Each dot represents the stimulus-evoked response of a cell (N = 9 mice; n = 240 cells). Blue dots indicate cells with more than a twofold increase on the later training day in comparison with the earlier training day. Red dots indicate cells with greater than twofold increase consistently across all 3 days of SAT1, 5, and 10. Circles indicate the rest of the cells. Pie chart indicates the percentage of cells showing greater than twofold increase (blue). (D–L) As in A–C, but for cell responses on ACC6 versus SAT1, ACC6 versus SAT5, and ACC6 versus SAT10, respectively. P values of Kolmogorov–Smirnov test and Wilcoxon signed-rank test in figures.



