


Prelimbic cortex ensembles promote appetitive learning-associated behavior
- 1Psychological and Brain Sciences, Boston University, Boston, Massachusetts 02215, USA
- 2Boston University School of Medicine, Boston University, Boston, Massachusetts 02215, USA
- 3Graduate Program for Neuroscience, Boston University, Boston, Massachusetts 02215, USA
- Corresponding author: dvsteve{at}bu.edu
Abstract
Memories of prior rewards bias our actions and future decisions. To determine the neural correlates of an appetitive associative learning task, we trained male mice to discriminate a reward-predicting cue over the course of 7 d. Encoding, recent recall, and remote recall were investigated to determine the areas of the brain recruited at each stage of learning. Using cFos as a proxy for neuronal activity, we found unique brain-wide patterns of activity across days that seem to correlate with distinct stages of learning. In particular, the prelimbic (PL) cortex was significantly recruited during the encoding of a novel association presentation, but its activity decreases as learning continues. To causally dissect the role of the PL in a reward memory across days, we chemogenetically inhibited first the PL entirely and then only tagged memory-bearing cells that were active during encoding in two stages of learning: early and late. Both nonspecific and specific PL inhibition experiments indicate that the PL drives behavior during late stages of learning to facilitate appropriate cue-driven behavior. Overall, our work underscores memory's role in discriminative reward seeking, and points to the PL as a target for modulating disorders in which impaired reward processing is a core component.
Past rewarding experiences are a significant factor in shaping the decisions we make in the future—we are more likely to repeat the actions which brought us pleasure, sustenance, and overall well-being (Thorndike 1927). Appetitive associative learning is the process used to describe how animals learn new rewards and imbue them with motivational salience (Martin-Soelch et al. 2007). Importantly, an excess of reward-seeking behaviors due to a disruption in the circuitry could lead to a maladaptive state (Bechara 2005; Cooper et al. 2017). In addiction, for instance, the strength of the positive memories associated with a behavior or reward makes it difficult to quit despite the damage caused to physical and social well-being (Sussman et al. 2011). For this reason, it has been suggested that addiction is a disease that hijacks the neural mechanisms of learning (Hyman and Tanabe 2005).
Many studies that look at how the brain processes learning have focused on fearful stimuli (Martin-Soelch et al. 2007), but behaviors specific to a positive or negative valence (e.g., running toward rather than away from a cue) require distinct learning components (Austin and Duka 2010). While much is known about how the brain produces aversive states (van der Schaaf et al. 2022), there is a clear need for additional research into how memories of reward are stored and updated throughout the learning process and the mechanism by which this changing memory biases actions. Additionally, breaking down associative appetitive learning into its crucial components will require consideration of both the neural mechanisms of reward and its impact on brain circuitry, along with the way the brain is able to create and store memories in a way that they can continue to inform future decisions.
In recent years, memories have been mechanistically studied through the neural trace they leave in the brain, commonly referred to as “engrams” (Liu et al. 2012; Josselyn and Tonegawa 2020). Associations between cues and context are thought to be encoded in these neuronal ensembles (Cruz et al. 2014). Recent studies suggest “neural traces” are fluid rather than static, as the brain undergoes reorganization across multiple areas to shift short-term memories into long-term memories (Roy et al. 2019). The hippocampus is crucial for the formation of a memory, with the trace gradually becoming more reliant on the neocortex (Kitamura et al. 2017). Moreover, learning causes changes in the neocortex and connected cortical regions in a process called consolidation (Squire et al. 2015). Specifically, the medial prefrontal cortex (mPFC) is implicated in both reward-seeking promotion and inhibition, regulated by the prelimbic (PL) cortex and infralimbic (IL) cortex sections, respectively (Caballero et al. 2019; Capuzzo and Floresco 2020; Timme et al. 2022). To that end, here we looked specifically at the role of the PL in the encoding and recall of an associative task in an effort to characterize the neural populations that are recruited across days of appetitive associative learning and how changes made across time facilitate the optimization of behavior.
Results
We developed a behavioral paradigm (Fig. 1A) in which mice were trained to associate light with a reward (i.e., sucrose water). Reward was obtained by performing a nose poke at the water port with sucrose water only available during the time when a light above the water port was on. Each session contained 15 consecutive trials and each trial contained a 30 sec light-on interval followed by a 60 sec light-off interval. The time spent obtaining sucrose water at the water port during light-on and light-off was measured and compared to determine whether mice were able to learn to discriminate. Over the course of 7 d of light training, behavior becomes stable by the end of the learning period (Fig. 1B).
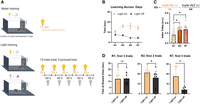
Mice learn to associate light with reward availability across two stages of training. (A) The behavioral paradigm was split into two periods. In the water training paradigm, the light was continuously turned on for the 30-min duration of the trial and mice could freely poke for sucrose water. The light training paradigm featured 15 alternating light-on/light-off trials, with sucrose water only available during the light-on interval. (B) Time spent poking for sucrose water during light-on and light-off periods on days 1, 3, 5, and 7 of light training (marked R1, R3, R5, and R7, respectively) shows an increase of time spent at the nose port during the light-on epoch and decreased time spent during the light-off epoch across days. A two-way mixed ANOVA was run to examine the impact of light (Light On vs Light Off) and time (R1 through R7) on poking behavior. There was a significant main effect of light, F(1,46) = 69.34, P < 0.0001, indicating that the presence of the cue drives poking during the Light On conditions. There was no significant main effect of day on the behavior, F(3,46) = 1.206, P = 0.3181, but there was a significant interaction effect of the two (F(3,46) = 3.466, P = 0.0236), indicating that the change in behavior is due to an interaction between both the day and the cue condition. (C) The discrimination difference (DD) was calculated to show the proportion of time spent at the water port during the light-on versus light-off period using the formula: (Poking during Light On [sec]/30) − (Poking during Light Off [sec]/60). Significant main effects were found for Day, indicating that mice were able to learn the meaning of the light and associate it with reward after going through training (F(2,37) = 6.627, P = 0.0035, R2 = 0.2637). (D) To further decipher whether or not light became associated with reward, the results of just the first three light-on and light-off periods were compared during R1, R2, and R7. Together, this shows that recognition for the light's significance was not present on day 1 of training (t7 = 0.1931, P = 0.852). By day 2 of training, significantly more time was spent at the nose port with the light present (t7 = 2.536, P = 0.039), indicating the learning of its significance. By day 7, there is an increasingly marked difference between time spent at the nose port between the light-on and light-off periods (t6 = 3.363, P = 0.0152). The increased variability of light-on behavior may be a side effect of habituation, as the mice receive a consistently large number of trials and may prefer to space out poking for sucrose water across more trials, no longer sensing the urgency in obtaining reward as quickly as possible.
In previous work studying the consolidation of fear memories, several key time points were outlined in the process of memory formation (Dixsaut and Gräff 2022). Day 1 was used as an encoding period, in which the memory trace first formed. Then, days 2 and 7 were used, respectively, as a marker of recent recall (Kitamura et al. 2017) and recall of a week-old memory, which we are using to represent remote recall (Gräff et al. 2012; Agee et al. 2023). Following this model, we examined behavioral patterns across days 1, 2, and 7 of cue training (referred to as R1, R2, and R7). We then calculated a DD for each subject using the following formula: (time poking during Light On/30) − (time poking during Light Off/60). The calculated difference provides a way to integrate behavior during both conditions into one “score” for the trial or session. A higher DD indicates a higher degree of poking in the light-on versus light-off condition, indicating improved cue discrimination. When looking at performance across days, there is a significant increase in DD from the start to as soon as the second day of learning (Fig. 1C), suggesting mice learn quickly that the reward is contingent upon cue presentation.
Furthermore, we quantified behavior during the start of the trial as a way of measuring recall of the task contingencies at the start of the training for the day by using just the behavior exhibited for the first three trials. We saw no difference between time spent at the nose port on day 1 of learning, indicating a lack of association between the light and reward. However, mice begin to discriminate between the two conditions by the start of day 2; by day 7, there is an even greater difference between time poking in the two conditions, indicating improved performance in the task due to continued learning (Fig. 1D).
Although these results show that mice are able to learn an associative task, the underlying neural circuitry remains unresolved. To dissect the mechanisms that allow for reward-seeking behavior to change across days, we leveraged the endogenous cFos system. cFos is an immediate early gene used as a proxy for neuronal activity and peak expression occurs 90 min post-exposure (Perrin-Terrin et al. 2016). We therefore adopted a whole-brain approach to examine cFos expression at our points of interest during learning which we could then use to find an area of interest to examine further.
Animals underwent our task as previously detailed and were time perfused at four points in the learning process (Fig. 2A). We used mice that did not enter light training (no association) but had undergone reward training as a control group (termed R0). We then chose R1, R2, and R7 to represent encoding, recent recall, and remote recall of the association, respectively. A second control group involved placing mice in the experimental box to experience 15 light-on and 15 light-off trials without access to the reward port, thereby tagging the cells active for novel context exploration (hereafter referred to as Ctx). Next, we performed whole-brain cFos counts and localized slices to their position in the brain atlas (Fig. 2B; Supplemental Fig. 1). Notably, most areas exhibited a global decrease in cFos by day 7 of learning. Figure 2C–N illustrates just a few key regions that had markedly different activity levels in different days of learning. Some to highlight are the overall decrease of cFos in areas of the hippocampus (Fig. 2H,I), in line with the theories of memory consolidation, and the increased activity in areas of the mPFC for the first day of learning only (Fig. 2C–E). Other areas exhibit unique patterns of activity. The caudoputamen (CPu) experiences a peak upon early exposure to reward that decreases by R7 (Fig. 2F). The basal amygdala (BA) and nucleus reuniens (RE) both peak during R2 (Fig. 2I,J). The paraventricular thalamus (PVT) and lateral habenula (LHb) have a similar pattern of activity, in which they are preferentially recruited during R0 and R2 and seem to be less active during Ctx and R7 (Fig. 2K,L). The medial habenula (MHb) was active during R1 and R2 before decreasing at R7 (Fig. 2M). Finally, the parasubthalamic nucleus (PSTn) is most active during R0 and least active during R2 (Fig. 2N).
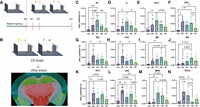
Whole-brain activity changes across days of associative learning. (A) In order to examine the changes occurring in the brain to accommodate learning, neural patterns were examined on days 1, 2, and 7 of learning (n = 7 per group). These three experimental groups are referred to as R1, R2, and R7, respectively. A control group (n = 7) was also examined, which was not exposed to light training but successfully completed water training (referred to as R0). A second control group (n = 4), in which mice were time perfused after being exposed to the experimental chamber with light-on and light-off periods, but no access to the sucrose water port (referred to as Ctx). (B) A representative image of QuickNII output, in which cFos counts were obtained (pictured here as gray dots) and classified by brain regions, according to the 2015 Allen Brain Atlas (http://mouse.brain-map.org/). (C–E) The three areas of the mPFC, the PL area (F(4,25) = 6.437, P = 0.0011, R2 = 0.5074), IL area (F(4,23) = 4.387, P = 0.0088, R2 = 0.4328), and anterior cingulate cortex (ACC) (F(4,25) = 3.591, P = 0.0191, R2 = 0.3649), with significant or trending data exhibit a similar pattern—there is an increase of cFos between controls and R1 before a significant or trending decline from R1 to R7. (F) The CPu has the lowest activity during Ctx, with a significant increase at R0 and R2 followed by a decrease at R7 (F(4,26) = 4.595, P = 0.0061, R2 = 0.4142). (G,H) The two parts of the hippocampus that significantly changed with time, the CA1 (H = 14.7, P = 0.0054) and dentate gyrus (DG) (F(4,25) = 3.866, P = 0.014, R2 = 0.3822), both increase with exposure to sucrose water and decrease significantly over the course of learning. (I) The BA was most active during R2 (F(4,25) = 3.651, P = 0.0178, R2 = 0.3688). (J) The nucleus RE shows significantly increased activity from R0 to R2 (H = 10.08, P = 0.0391). (K) The PVT, although does not exhibit a significant change, does exhibit a trend toward decreased cFos between R0 and R7 (F(4,27) = 3.970, P = 0.0116, R2 = 0.3704). (L) The LHb increases its activity with the addition of reward availability (F(4,27) = 6.867, P = 0.0006, R2 = 0.5043). Activity decreases during encoding and increases during recent recall. (M) The MHb is activated by the presentation of the cue discrimination task and decreases with days of learning (F(4,26) = 4.784, P = 0.0050, R2 = 0.4239). (N) The PSTn exhibits peak cFos expression on R0, which returns to baseline on R2 (H = 15.23, P = 0.0043). Bars are plotted as mean ± 95% confidence interval (CI). P < 0.05 is considered significant, 0.05 < P < 0.15 is considered trending.
We next performed linear regressions to examine whether the level of activation of any areas is associated with behavior observed during early or late learning. We first looked at distance traveled (Supplemental Fig. 2A) and velocity (Supplemental Fig. 2B) and found that there was no association between cFos activity and movement, indicating that cFos expression was not being driven by motion-related metrics. We next looked at areas associated with reward-seeking behavior during the light-on condition. Looking at the DD and its association with activity, we found that R1 was characterized by a moderate negative association between DD and PL (Supplemental Fig. 3C). The PL also exhibited a strong positive correlation with cue-driven reward-seeking behavior in R7 (Supplemental Fig. 3B). Interestingly, the correlation between behavior and cFos activation changes from negative in R1 (Supplemental Fig. 3A,C) to positive in R7 (Supplemental Fig. 3B,D) for all significant regressions, meaning that better performers in R1 had the lowest activity brain-wide but better performers in R7 were the ones that had a greater level of cFos-positive cells.
The PL in particular has been shown to play a central role in adaptation, learning, and building behavioral strategies, as well as the encoding and expression of cue-dependent negative associations (Sharpe and Killcross 2015). Our data suggested that the PL exhibits a marked increase of cFos in early learning (Fig. 2C) but paradoxically has a strong association with both reward-motivated behaviors on the last day of learning, following a decrease in cFos-mediated activity, and the DD on the first day of learning when cFos activity is at its peak (Supplemental Fig. 3). Accordingly, we investigated the neural populations within the PL that are recruited for R1 and R7 to determine how they change to accommodate the shift in behavior. In other words, we asked whether the cells recruited for the encoding of an appetitive associative task are the same cells active during the late stages of learning when animals significantly improved their DD.
To do so, we injected the PL with a doxycycline-dependent cFos-tTa/TRE-mCherry virus cocktail (Fig. 3A). With this genetic strategy, removal of doxycycline from an animal's diet permits the labeling of cells active during a defined window of time, which we used to broadly capture R1. Namely, we trained a separate group of mice and tagged cells active during the encoding of the association which we defined to occur in R1 (Fig. 3B). We continued training up until R7, then time perfused to capture an endogenous cFos trace late learning. We quantified the two tagged experiences in the PL (histology shown in Fig. 3C–G) to determine whether behavioral consolidation requires reactivation of the same cells over time, or if there is an entirely different population of cells that is driving behavior. An immunohistochemical analysis showed that there was a higher overlap of cells between the two populations than what would be predicted by chance (Fig. 3H), indicating that these are not two fully independent populations of cells. When averaging the number of cells tagged for both memories across mice, an average percentage of cells active during R1 that was recruited again during R7 was 55.8% (Fig. 3I). We then questioned if there was an association between the learning-driven change in behavior across days and the percentage of R1-activated cells recruited again for R7. Performing linear regressions showed that there is a marginal positive association between the percentage of overlapping cells with the change in poking behavior during light-on trials (Fig. 3J) and a strong correlation with the change in DD (Fig. 3L), but only a weak association with the change in poking behavior during light-off trials (Fig. 3K), indicating that recruitment of the R1 engram in PL during R7 has some association with the improvement in discrimination of the cue occurring between these two points in learning.
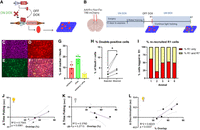
Characterizing the consolidation of PL engram cells. (A) A pictorial representation of the tet-Tag system, which is used to create an activity-dependent tag of an experience. (B) Mice (n = 5) were taken off Dox at the end of water training, 24 h before R1. Encoding of the association (R1) was tagged, and mice were immediately placed back on Dox to close the tagging window. Animals continued light training and were time perfused immediately after R7 to get the endogenous cFos pattern of late learning. Representative images of the PL are shown in C–F. (C) Nuclear marker, NeuN. (D) cFos-tTa-TRE-mCherry labeled cells activated during R1. (E) c-Fos labeled cells activated during R7. (F) Merge of all channels. The red circle identifies a cell with only a mCherry tag, the green circle indicates only a cFos tag, and the yellow circle indicates a cell with both the mCherry and cFos tags. (G) Percentage of mCherry-positive, cFos-positive, and double-positive cells from total cells (NeuN+). (H) The percent of observed double-tagged cells is compared to chance, calculated using the formula (# mCherry-positive cells/# NeuN-tagged cells) * (# cFos-positive cells/# NeuN-tagged cells). There is a significant difference between the two, indicating that there is more overlap than if the two populations were independent (t4 = 3.111, P = 0.0358). (I) This stacked bar chart represents the percentage of reactivated cells. The proportion of cells that were activated in both R1 and R7 are shown in yellow, expressed as a percentage of the R1 tag. The remaining cells, representing the cells that were only active during R1 and were not brought back online for R7, are shown in red. (J–L) The change in behavior from early to late learning was quantified and linear regressions were performed. The change in time spent poking for sucrose water during the light-on paradigm was marginally correlated with percentage of overlapping cells and strongly correlated with DD. There was an insignificant association between the % overlapping cells and change in light-off behavior.
To test whether the PL is necessary for encoding of the task, we chemogenetically inhibited cells from the entirety of the PL on the first day of cue association training (Fig. 4A–D). Inhibition of the PL during encoding had no effect on any performance metric (Fig. 4E). During R2 and R7, all groups performed similarly and there were no significant differences in behavior in any metric, showing that early DREADD inhibition had no short- or long-term effects on behavior (Fig. 4G). When the PL was inhibited during an additional day of remote recall (R8), however, mice exhibited a change from controls, namely, an increase in unrewarded poking behavior during light-off (Fig. 4H). Looking longitudinally across learning, there was no significant difference between behavior during R7, the last day of typical learning, and R8, the day of PL inactivation (Fig. 4I). This suggests that inhibition of the PL during early learning does not significantly change the process of association learning, but inhibition during late stages of learning halts the continued fine-tuning of behavior that would occur normally as mice continue to refine their strategy.
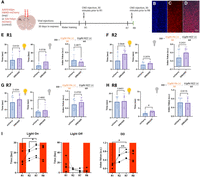
Chemogenetic inactivation of the PL cortex during late stages of learning, but not early stages, disrupts association-driven behavior. (A) Experimental groups (n = 5) were injected with an inhibitory DREADD virus while control groups received mCherry vector instead (n = 6). The virus was given 30 d to express before the start of water training. Mice went through the standard 3 d of water training. Half an hour prior to the beginning of light training (R1), mice were intraperitoneally injected with clozapine-N-oxide (CNO) to chemogenetically inactivate the PL for the duration of the task. After R1, mice continued to train for the remainder of the task. Unlike previous experiments, there was another day (R8) run, before which the mice received another CNO injection to inactivate the PL once more. Representative images of the PL are shown in B–D. (B) Nuclear marker, DAPI. (C) hSyn-hM4Di-mCherry labeled cells during peak expression. (D) Merge. (E) With the PL being chemogenetically inhibited during encoding, behavioral results from R1 show that DREADD mice do not exhibit any changes in reward-seeking behavior during the light-on (t8 = 0.5225, P = 0.6154) or light-off (t8 = 2.055, P = 0.0739), which is reflected in the DD between the two groups not varying significantly (t9 = 0.7583, P = 0.4677). (F) The day of learning following PL inhibition, the experimental and control groups of mice do not appear to vary significantly during either light-on (t8 = 1.908, P = 0.0928), light-off (t8 = 1.220, P = 0.2574), or in their DD (t9 = 1.249, P = 0.2431). (G) Following 6 d of unperturbed learning, behavioral outputs on R7 show that DREADD mice exhibited a normalization of behavior, as all behavioral outputs were not statistically different from controls (Light-on: t9 = 0.8275, P = 0.4294) (Light-off: t9 = 0.7555, P = 0.4692) (DD: t9 = 0.7537, P = 0.4703). (H) Upon performing another round of PL inhibition during remote recall, DREADD mice exhibited a significant increase in poking during the light-off period (t8 = 2.600, P = 0.0316) without a change in light-on behavior (t9 = 0.2038, P = 0.8431). This change in poking during the light-off was also not big enough to significantly affect the DD (t9 = 0.1144, P = 0.9115). (I) Looking longitudinally across days of behavior for the experimental group, there is no significant change in any metric of behavior between R7 and R8 associated with the DREADD inactivation of PL cells. Red bars represent the day of inactivation.
Seeing that there was a significant number of cells recruited for late learning that came from the PL population recruited during initial learning (Fig. 3I), we next examined the role of these overlapping cells in the final associative memory. To do so, we injected mice with either an activity-dependent DREADD or a non-DREADD control, AAV9-cFos-tTA-TRE-hM4Di-mCherry or AAV9-cFos-tTA-TRE-mCherry, respectively. Using the activity-dependent DREADD, we tagged the initial associative memory (R1) and selectively inhibited just those cells during late learning (Fig. 5A–D). Early behavior was not significantly different between control and experimental groups (Fig. 5E), but inhibition of early memory-bearing cells during R8 resulted in a significant decrease in poking behavior during the light-on, but not the light-off, condition (Fig. 5F). Behavioral comparison between R7 and R8 of the experimental group further showed a significant deficit in poking behavior compared to the prior day of learning that is isolated solely to the light-on condition (Fig. 5G).
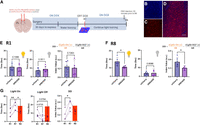
Chemogenetic inactivation during the late stages of learning of PL cortex cells required for early learning decreases cue-driven behavior. (A) Mice were injected at previously detailed PL coordinates with either an engram-specific hM4Di DREADD (n = 5) or a cFos-tTa-mCherry control (n = 6). The population of cells active during the first exposure to associative learning will be chemogenetically inhibited during late learning to determine whether that population of cells required for early learning is necessary for association-driven behavior or if there are neural mechanisms that compensate for the loss of those cells. Representative images of the PL are shown in B–D. (B) Nuclear marker, DAPI. (C) cFos-tTa-TRE-hM4Di-mCherry labeled cells, tagged during R1 and inhibited in R8. (D) Merge. (E) There is no significant difference between the behavior of the control and experimental groups during R1 (Light on: t10 = 0.3596, P = 0.7266) (Light off: t10 = 0.9760, P = 0.3511) (DD: t9 = 0.3611, P = 0.7263), suggesting that a similar population of cells will be tagged for later deactivation. (F) With engram-specific PL inhibition occurring in late learning, a deficit is seen during the light-on paradigm (t8 = 2.753, P = 0.0250). Namely, the DREADD group exhibits a deficit in reward-seeking behavior during periods of cue availability that are not seen when the light is turned off (t8 = 0.1840, P = 0.8586), but are reflected in a significant decrease of the DD (t8 = 2.664, P = 0.0286). (G) This panel of three graphs compares behavior exhibited during R1, R7, and R8 for the experimental DREADD group to show that learning proceeded normally until inactivation took place, at which point all subjects exhibited an impairment of poking behavior during periods of cue availability. These differences are not enough to create a significant impairment of the DD. Red bars represent the day of inactivation.
Taken together, these chemogenetic experiments suggest that the PL plays a significant role in shaping cue-dependent behaviors in late learning. Although the PL as a whole seems to fine-tune behavior during the light-off epoch, inactivation of the memory-bearing cells representing the first exposure to a cue association significantly decreases reward-seeking behavior during the light-on epoch.
Discussion
Appetitive associative learning requires systems involved in memory consolidation, reward processing, and strategy building (Martin-Soelch et al. 2007). Here, we examined the neural correlates of associative appetitive learning across days in male mice. Mice were trained to associate light with reward availability and their behavior was scored during light-on and light-off trials. Learning was assessed through the DD, in which higher scores indicated a stronger association of stimulus with reward. The DD improved significantly as training continued (Fig. 1), showing that mice were able to learn to discriminate a cue condition and adjust their behavior accordingly. To avoid biasing our approach to target any one of the many circuits activated by a reward-driven associative task, we chose to use a whole-brain approach to capture a wider range of changes that occur with appetitive learning. Namely, this project seeks to characterize the neural populations recruited across days of appetitive associative learning and the changes made across time to facilitate both learning and the optimization of behavior.
To explore how changes in behavior inherent to our appetitive learning correlated with brain activity, we used cFos as a marker for activity and obtained cell counts for mice that went through days 1, 2, or 7 of learning the association (R1, R2, and R7). We counted cFos for a group of mice that received reward only (R0), and a group of mice that had unrewarded exposure to the experimental box and flashing light (called the Ctx group), which we used to distinguish the effect of learning from the effects of receiving reward and a novel context, respectively.
Leveraging a brain-wide approach in Figure 2, we show key regions that exhibited different patterns of activity across days. Across the brain, early stages of learning increase the number of active cells. The number of active cells then decreased by late stages of learning in every region we measured despite the improvement in behavior (Fig. 1). This global decrease could be cellular consolidation, which is hypothesized to reduce the “halo” of cells (i.e., the speculation that learning recruits a surplus of cells on day 1 that are then fine-tuned and/or sculpted on subsequent days into a more quiescent state) that surround the trace encoding the association and become redundant as the memory trace becomes more stable (Garagnani et al. 2009).
To delve deeper into the exhibited differences in learning across animals, we performed linear regressions on the regions where we had significant differences in cFos counts to tease out areas important for this associative learning task. At the end of learning (R7), an increase in the level of activation is correlated with improved discrimination (Supplemental Fig. 3), which corresponds with literature showing that the activity of cells active during remote recall is correlated with performance in a task related to declarative memory (Furman et al. 2012). Thus, although cFos activation across the brain decreased globally while discrimination was improving across days of learning, a higher number of recruited cells at the end of consolidation results in improved discrimination. While seemingly contradictory, we believe this is indicative of a consolidation mechanism that fine-tunes the neural activity required for approach behaviors that may not be fully captured with the low temporal resolution of cFos but can still be partly characterized by examining the underlying engram and how it changes across days.
Next, we observed that the PL and IL were preferentially recruited in R1 (Fig. 2), indicating their importance for adjusting behavior to fit newly encoded rules. In particular, the PL has been implicated in playing a role for the initiation and suppression of actions, as well as overriding prepotent behaviors (Capuzzo and Floresco 2020). In our experiments, the changing correlations of cFos with behavior across days of learning indicated that the level of engagement of mPFC ensembles varies with behavioral improvement (Supplemental Fig. 3). Early in learning, the animals poke equally regardless of cue presentation; by 2 d, there is an increasing in poking behavior only during the cue presentation without affecting the behavior during the cue's absence; and by day 7, the animals nose poke consistently in response to the cue while decreasing the nose pokes occurring in the cue's absence (Fig. 1). Measuring general cFos levels reveals that the amount of cFos positive cells in the PL and IL on day 7 are at their lowest for the task (Fig. 2). This indicates that, although the brain must undergo consolidation for optimization, the cells that remain seem to be the ones that preferentially drive behavior. Overall, mice with more Fos-expressing PL cells by the end of training have better discrimination, indicating the continued importance of this population.
Considering the decreased number of cFos-positive cells seen in the PL (Fig. 1) in late stages of learning and the increased reliance on these cells in relation to reward-seeking behavior (Supplemental Fig. 3), we delved into the relationship between the neural populations recruited in early and late stages of learning. By tagging the memory trace of the first day of learning and comparing it to the memory trace of the end of learning, we found that an average of 56% of PL cells recruited during R1 are recruited again during remote recall (Fig. 3). The role played by this population of reactivated cells in driving behavior in late stages of learning (R7) compared to the role of the PL as a whole in driving behavior was an area that we wanted to explore further.
To investigate the importance of the PL in appetitive associative learning, we chemogenetically inhibited the entirety of the area during R1 and R8 to determine the role it plays in both early and late learning. Inhibiting the PL on the first day of learning (R1) yields no significant difference in behavior (Fig. 4), which is surprising considering that the PL is most active during R1 (Fig. 2). We speculate that the brain is able to adjust for the loss of the PL in encoding and beyond, as there is no difference between the continued learning of control and experimental animals (Fig. 4). This may indicate that, although the PL appears to be heavily recruited for early learning, its role may evolve over time and recruit additional compensatory mechanisms for memory expression (Kitamura et al. 2017). A future experiment could perform whole-brain cFos staining following PL inhibition during R1 to determine specifically what areas of the brain are activated to compensate for the loss of the PL in the early stages of learning.
Next, we investigated the effect of PL inhibition during the late stages of learning and found that inhibition at this time results in a deficit in task performance (Figs. 4, 5). This suggests that, although the PL appears to be most active during R1 (Fig. 2), its significance for associative learning is most clear in the late stages. Previous work showed the significance of the PL in guiding behavior at late stages of recall in the recall of negative contexts (Kitamura et al. 2017), and our results suggest that the role of the PL may be indicated in late stages of positive contexts as well.
Furthermore, we see different impairments when chemogenetically inhibiting engram cells compared to inhibition of the whole PL (Figs. 4, 5). This may be because of the functional diversity of the neural populations within the PL compared with the relative specificity of engram cells. By inhibiting just the engram cells, the memory process is disrupted in a manner that is more selective, leaving the rest of the PL capable of compensating for the loss. In contrast, inhibiting the entire PL affects all cellular functions in that region, potentially disrupting a wider range of processes and leading to more generalized behavioral effects. Therefore, when the engram cells representing R1 were inhibited during R8, the inhibition resulted in an impairment of behavior (decreased poking) during the light-on period. This suggests that engram cells recruited during the early stages of learning may be the ones responsible for driving the reward-driven behavior corresponding to the cue association, which is further supported by the correlation between higher percentages of re-recruited cells between R1 and R7 and improvement in behavior between the two stages (Fig. 3). In future work, we can examine any putative compensatory mechanisms that occur in these two distinct chemogenetic inhibitions that facilitate the change in behavior.
Altogether, the difference in behavioral output from inhibiting the two cell populations outlined above suggests an underlying mechanism connecting PL engram cells to the rest of the cells found in the PL. In this case, the inhibition of PL engram cells results in decreased poking during the light-on periods (Fig. 5). It is nonetheless possible that the cue activates engram cells that increase poking behavior during the light cue. At the same time, a decrease in cFos levels in the PL corresponds with improved discrimination, namely, increased poking during the light-on condition and decreased poking during the light-off condition. Moreover, when the PL is globally inhibited, we see an increase in time spent poking during the light-off and no change during the light-on periods, suggesting PL cells might be suppressing poking for reward indiscriminately (Fig. 4). This suggests that the PL could have distinct roles throughout the different stages of learning a cue association: Early learning may require the PL to improve recognition of a cue, preferentially driving behavior during the light-on period (Fig. 5), whereas late learning requires the PL to improve behavioral strategy by preventing extraneous poking (Fig. 4).
An alternative hypothesis is that PL may be more significant during the late stages of learning. This is seen in other work that examines the contribution of the ACC and hippocampus during recent and remote recall, where inhibition of the CA1 during recent recall was not enough to impair recall if ACC activity levels rose as a compensatory mechanism. In remote recall, however, the inhibition of either the ACC or CA1 was able to disrupt remote memory recall (Goshen et al. 2011). In our work, the PL may follow a similar pattern: There are a large number of areas that exhibit high levels of cFos activity during R1 (Fig. 2) that may be able to compensate for the early inhibition of the PL. In later stages, however, the PL appears to be more indispensable during the late stages of learning (Figs. 4, 5), especially when the engram cells are specifically targeted.
Future work could be done to determine whether there is a difference in brain areas recruited for cue-driven behaviors in females. Additionally, although we chose to focus on the further characterization of the PL and its role in cue conditioning, there were other areas that exhibited unique patterns of activation between stages of learning that could also be explored. Namely, the LHb and MHb were both very active in learning compared to R0 and Ctx but each exhibited a different excitation pattern as learning progressed. Additionally, our future work may examine the evolution of an appetitive associative memory using a method like one-photon microscopy with improved temporal resolution to better understand how cellular consolidation occurring between R1 and R7 facilitates the improvement in discrimination by the end of learning.
Materials and Methods
Animals
Sixty-two experimentally naive, male c57bl/6 mice (2–3 mo of age) were obtained from Charles River Laboratories. Animals were housed in groups of up to five mice per cage. The animal vivarium was maintained on a 12:12-h light cycle (lights on at 7 a.m.). Mice were water deprived 1 d before training, with all animals receiving at least 1 mL of water per day throughout the entire duration of being water deprived. Animals were provided with ad libitum access to food, with mice in engram-tagging groups being placed on a Dox diet before surgery. Mice were given at least 7 d after surgery to recover prior to the start of any behavior. Dox was replaced with standard mouse chow 24 h before behavior to open a time window of activity-dependent labeling (Liu et al. 2012). The colony room was maintained on a 12-h light–dark cycle. Behavior was run under dim red light and testing occurred at a consistent time to avoid temporal activity confounds. Experimental procedures were approved by IACUC.
Stereotaxic surgery
Mice were anesthetized using isoflurane (inducted at 4%, lowered to 2%–3% for the maintenance during surgery) and placed in the stereotaxic frame atop a heating pad to maintain body temperature. Hair was removed with a hair removal cream, and ophthalmic ointment was generously applied to both eyes to prevent corneal drying. The surgical site was cleaned with alternating applications of betadine and ethanol. An incision was made with a scalpel to expose the skull. The brain was then zeroed relative to the skull, and the following coordinates were used: 2.0 anteroposterior (AP), 0.3 mediolateral (ML), and −1.8 dorsoventral (DV) for the PL.
For overlap experiments, mice were injected with 300 µL of AAV9-cFos-tTa-TRE-mCherry at a rate of 100 µL/min. When performing injections, the needle was lowered to −2.05 DV and left to rest for 3 min before being pulled up to −2.0 and injected. Then, the needle remained at −2.0 for 5 min before being removed. The virus was given at least 7 d to express before the start of the experiment.
For chemogenetic inhibition of the PL, the following viruses were injected: AAv5-hSyn-hM4Di-mCherry for the experimental group and AAV-hSyn-mCherry for the control group. The virus was injected at a volume of 200 µL at a rate of 100 µL/min. These viruses were given at least 30 d to express before the start of the experiment.
Behavior
The training was conducted in Med Associates operant conditioning boxes controlled by Trans V software. A dispenser with 10% sucrose water connected to a nose port was located at one end of the chamber, along with a light. Before training, mice were placed on water deprivation to increase their motivation to obtain the reward. The behavioral task is described in Figure 1A and will also be detailed here.
Mice first underwent one-to-one water training, in which the light was constantly on and they could freely gain access to sucrose water at any point during the allotted time by performing a nose poke. Animals went through 3 d of water training, and all got at least 100 rewarded nose pokes within the 15-min trial duration before advancing into light training. The reason for including a water training period before the light training period is to ensure that our tag was not targeting any novelty related to the experimental setup or the presented reward. In the light training, sucrose water was no longer freely available during the task but rather during select periods indicated by the light cue. When the light cue turned on, the mouse then had 30 sec in which it could poke for sucrose water. After time was up, sucrose water was unavailable for the period of time that the light was off (60 sec). This task was modified from a task previously used to teach reward (Bravo-Rivera et al. 2021). Importantly, operant conditioning across days promotes the encoding of an associative memory that must be actively recalled for the duration of the task.
Histology
Mice were sacrificed and perfused transcardially with phosphate-buffered saline (PBS) followed by 4% paraformaldehyde (PFA) in PBS. Brains were then extracted and stored in PFA for at least 24 h. Brains were sliced coronally at increments of 50 µm using a vibratome and stored at 4°C in 0.01% sodium azide in PBS. Two protocols were used to stain brains for whole-brain cFos experiments and for overlap experiments.
When staining was performed for cFos alone, slices were washed with PBS for three washes of 10 min, then blocked on a shaker for 1.5 h using 5% bovine albumin serum (BSA). Slices were then moved to wells with primary antibodies in 1% BSA (1:1000 rabbit anti-cFos [Abcam]) and allowed to incubate for 48 h on a shaker at 4°C. For overlap experiments, a different set of primary antibodies (1:1000 each of guinea pig anti-RFP [SySy] and rat anti-cFos [Millipore] and 1:500 of rabbit anti-NeuN [SySy]) and secondary antibodies (1:200 each of Goat Anti-Rat 488 Alexa Fluor [Abcam], Goat anti-Guinea Pig 555 Alexa Fluor [Abcam], and Goat Anti-Rabbit 647 Alexa Fluor [Abcam]). Two days later, slices were washed in PBS for three washes of 5 min each, then were allowed to incubate for 1.5 h with secondary antibodies in 1% BSA (1:200 Alexa Fluor 555 goat anti-rabbit [Thermo Fisher]) before being washed with PBS once more for four washes of 10 min each. Slices were then mounted on slides using Vectashield HardSet Mounting Medium with DAPI (Vector Laboratories), coverslipped, and dried at room temperature overnight before being moved into the fridge.
Dox system
We leveraged our activity-dependent and inducible system, cFos-tTa cocktailed with TRE-mCherry. Three hundred microliters of the virus was injected bilaterally in the PL at previously specified coordinates. The tTa, when bound to TRE, triggers the expression of the mCherry and allows an activity-dependent neuronal subset to be captured. To prevent tTa transcription of off-target neurons, animals were raised on a Dox diet and taken off Dox the day before tagging.
Chemogenetic manipulation
CNO was used as the ligand for selectively activating the injected DREADDs (designer receptors exclusively activated by designer drugs). CNO was made within 24 h of experimental use; 1.2 mg of dried CNO was added to 10 µL of 10% DMSO and 1990 µL of saline to create 2 mL of 0.6 mg/mL solution. Then, doses were administered to be equivalent to 3 mg/kg per animal. Administration of CNO was performed 30 min before the beginning of behavior.
Image acquisition and analysis
Single labeled cFos
Whole slices were imaged at 10× magnification. Using ImageJ, images were then adjusted to make them a uniform size, and a z-stack was created using the average intensity of cells. Images were then split by color channel, with blue representing DAPI and red representing cFos. To perform brain-wide cFos counts, the QUINT workflow developed by the Human Brain Project (Puchades et al. 2019) was used. DAPI images were imported into QuickNII for use in localizing the brain slice with its respective location in the brain atlas. cFos images were processed using ilastik and a simple segmentation of the image was exported. The ilastik output was combined with the QuickNII output in the Nutil workflow to yield cFos counts per region, which was then further normalized to the area.
Overlaps
The PL was imaged at 20× magnification. Using ImageJ, one composite image was created per slice using maximum projections of each channel. Overlapping cells between different channels in the composite were analyzed using QuPath software (Bankhead et al. 2017).
Statistical analysis
All data analyses were performed in GraphPad (Prism 9 for Windows, GraphPad Software). Data sets were tested for normality using the Shapiro–Wilk test and analyzed using either t-tests or ordinary one-way ANOVAs for normally distributed data, and Kruskal–Wallis tests for data that did not pass the normality test. P < 0.05 was considered statistically significant.
Acknowledgments
This work was supported by a Ludwig Family Foundation grant, a National Institutes of Health (NIH) Early Independence Award (DP5 OD023106-01), an NIH Transformative R01 Award, a Young Investigator Grant from the Brain and Behavior Research Foundation, the McKnight Foundation Memory and Cognitive Disorders Award, the Pew Scholars Program in the Biomedical Sciences, the Air Force Office of Scientific Research (FA9550-21-1-0310), the Chan-Zuckerberg Foundation, and the Center for Systems Neuroscience and Neurophotonics Center at Boston University. All figures were created with BioRender. Additionally, thank you to Hector Bravo for his contributions to the aesthetics of earlier versions.
Footnotes
-
[Supplemental material is available for this article.]
-
Article is online at http://www.learnmem.org/cgi/doi/10.1101/lm.053892.123.
- Received September 27, 2023.
- Accepted January 30, 2024.
This article is distributed exclusively by Cold Spring Harbor Laboratory Press for the first 12 months after the full-issue publication date (see http://learnmem.cshlp.org/site/misc/terms.xhtml). After 12 months, it is available under a Creative Commons License (Attribution-NonCommercial 4.0 International), as described at http://creativecommons.org/licenses/by-nc/4.0/.



