


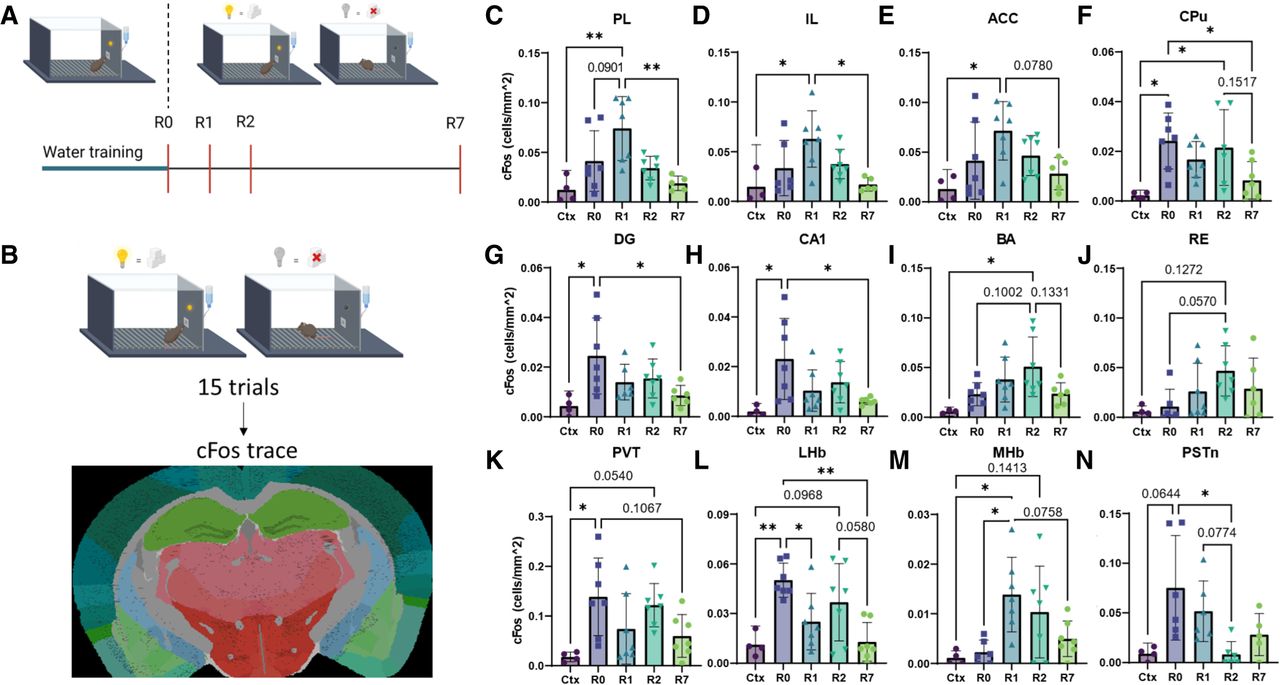
Whole-brain activity changes across days of associative learning. (A) In order to examine the changes occurring in the brain to accommodate learning, neural patterns were examined on days 1, 2, and 7 of learning (n = 7 per group). These three experimental groups are referred to as R1, R2, and R7, respectively. A control group (n = 7) was also examined, which was not exposed to light training but successfully completed water training (referred to as R0). A second control group (n = 4), in which mice were time perfused after being exposed to the experimental chamber with light-on and light-off periods, but no access to the sucrose water port (referred to as Ctx). (B) A representative image of QuickNII output, in which cFos counts were obtained (pictured here as gray dots) and classified by brain regions, according to the 2015 Allen Brain Atlas (http://mouse.brain-map.org/). (C–E) The three areas of the mPFC, the PL area (F(4,25) = 6.437, P = 0.0011, R2 = 0.5074), IL area (F(4,23) = 4.387, P = 0.0088, R2 = 0.4328), and anterior cingulate cortex (ACC) (F(4,25) = 3.591, P = 0.0191, R2 = 0.3649), with significant or trending data exhibit a similar pattern—there is an increase of cFos between controls and R1 before a significant or trending decline from R1 to R7. (F) The CPu has the lowest activity during Ctx, with a significant increase at R0 and R2 followed by a decrease at R7 (F(4,26) = 4.595, P = 0.0061, R2 = 0.4142). (G,H) The two parts of the hippocampus that significantly changed with time, the CA1 (H = 14.7, P = 0.0054) and dentate gyrus (DG) (F(4,25) = 3.866, P = 0.014, R2 = 0.3822), both increase with exposure to sucrose water and decrease significantly over the course of learning. (I) The BA was most active during R2 (F(4,25) = 3.651, P = 0.0178, R2 = 0.3688). (J) The nucleus RE shows significantly increased activity from R0 to R2 (H = 10.08, P = 0.0391). (K) The PVT, although does not exhibit a significant change, does exhibit a trend toward decreased cFos between R0 and R7 (F(4,27) = 3.970, P = 0.0116, R2 = 0.3704). (L) The LHb increases its activity with the addition of reward availability (F(4,27) = 6.867, P = 0.0006, R2 = 0.5043). Activity decreases during encoding and increases during recent recall. (M) The MHb is activated by the presentation of the cue discrimination task and decreases with days of learning (F(4,26) = 4.784, P = 0.0050, R2 = 0.4239). (N) The PSTn exhibits peak cFos expression on R0, which returns to baseline on R2 (H = 15.23, P = 0.0043). Bars are plotted as mean ± 95% confidence interval (CI). P < 0.05 is considered significant, 0.05 < P < 0.15 is considered trending.



