


Hippocampal contribution to vector model hypothesis during cue-dependent navigation
- 1Department of Psychology, National University of Ireland Maynooth, Maynooth, County Kildare, Ireland
- 2Systems Biology Ireland, Conway Institute, University College Dublin, Dublin, Ireland
Abstract
Learning to navigate toward a goal is an essential skill. Place learning is thought to rely on the ability of animals to associate the location of a goal with surrounding environmental cues. Using the Morris water maze, a task popularly used to examine place learning, we demonstrate that distal cues provide animals with distance and directional information. We show how animals use the cues in a visually dependent guidance manner to find the goal. Further, we demonstrate how hippocampal lesions disrupt this learning mechanism. Our results can be explained through the vector model of navigation built on associative learning principles rather than evoking a cognitive map.
Being able to successfully navigate between two points is an essential skill for the survival of animals. A navigating animal is thought to have two sources of information with which it can locate itself within an environment: egocentric and allocentric (Pearce et al. 1998; Aggleton et al. 2000; Begega et al. 2001; Valerio et al. 2010). In egocentrically based navigation, animals can use view-dependent information, whereby any available external information (e.g., cues or landmarks) is represented in relation to the animal itself (Brown 1992; Maurer and Derivaz 2000). Alternatively, animals can rely on information gained from their own motor movements in relation to a specific point in their journey to get to their goal (Whishaw et al. 2001). Allocentric navigation involves defining a place relative to another location or to another object (e.g., remote landmarks) and is independent of the viewer (Bures et al. 1998). Typically, the cues or landmarks remain stable and are at some distance away from the goal, thus allowing the animal to locate its target in relation to those cues (Whishaw et al. 2001).
During allocentric navigation, multiple available cues can be used, whereby the navigator processes the spatial relationship between the cues and the goal in order to memorize the target’s position (Benhamou and Poucet 1998; Allen 2004). It has been suggested that there are two components to this process. First, the establishment of spatial relationships between landmarks in the environment and, second, the updating of distance and direction from start to goal with reference to information external to the navigator. By using and processing this type of environmental information, it has been suggested that a “map” of the layout of an environment can be developed (Tolman 1948).
One such widely known and examined “map”-like representation is the cognitive map of O’Keefe and Nadel (1978). This map is developed from the spatial information gained from a previously encountered environment and has been defined as a stable Euclidean representation of the distances and directions between landmarks and locations. A critical feature of the “map”, which allows for highly efficient and flexible navigation, is that the moving animal gains information from its surroundings that is also beyond their direct field of perception, allowing for short cuts and novel paths to be taken (Poucet 1993). O’Keefe and Nadel (1978) proposed that for the map to be successfully generated, the animal must first thoroughly explore its environment; the acquired details of this exploration would then become integrated in the map-like system, subsequently reducing the need for further exploration once it is established. Cognitive mapping theory also proposes that the hippocampus is the neural structure dedicated to creating these map-like representations of space (Morris et al. 1982). However, although cognitive map theory has received much attention, some of the findings reported to confirm these ideas are somewhat imprecise and thus not easily understood (Eichenbaum et al. 1999). Furthermore, there may be simpler explanations to account for animal navigation without evoking the notion of a cognitive map.
One example of this comes from associative learning theory, which is a more recent alternative to the cognitive mapping model of spatial representation. It postulates that allocentric space may be simply represented as an associative mechanism (Miller and Shettleworth 2007), where one factor (be it object or action) can be learned only through the association with a separate, pre-occurring factor. So rather than building up an overall representation of the layout of an environment, which may be cognitively taxing, the navigator need only associate individual items in the environment as required. For example, in the Morris water maze (MWM) (a popular task used to test spatial memory) successful navigation can also be attributed to an associative mechanism, whereby visual cue(s) can become associated with the availability of an escape (Sanchez-Moreno et al. 1999; Hamilton et al. 2004). Indeed, key elements of associative theory, including cue competition, blocking, and overshadowing, have all been reported for place learning in this task (Rodrigo et al. 1997; Sanchez-Moreno et al. 1999; Chamizo et al. 2006). Therefore when a number of cues or landmarks are available, associative theory predicts that during learning the animal will weight some cues as more important than others. So rather than constructing a “map” that incorporates all of the environmental stimuli in an all-or-none manner as described by O’Keefe and Nadel (1978), the animal weights the importance of specific individual cues or landmarks with goal finding. Derived from the traditional learning model of Rescorla and Wagner (1972), a recent model of spatial learning developed by Miller and Shettleworth (2007) extends the idea of cue competition to incorporate geometric cues. This model suggests that geometric cues (e.g., shape of environment) must also adhere to the same associative rules. The authors also include a probability rule for approaching or avoiding locations. While there are many aspects of spatial learning that fit readily into such a model, there are some elements not accounted for (see, for example, McGregor et al. 2009). Further, this model says nothing on the role of directional and distance information that may be provided by cues, particularly those cues that are located at a distance from the goal.
The vector model (Collett et al. 1986), typically applied to insect navigation, may offer a more sophisticated alternative, as it takes some of these issues into account. While similar to a cognitive map, the model has been interpreted as involving a simpler representation, developed through associative processes, rather than an “all-or-none” manner (Collett et al. 1986; Pearce et al. 2004; Esber et al. 2005; Leising and Blaisdell 2009). This model suggests that animals can use multiple cues in the form of vectors (containing directional and distance information) to guide them to a goal (Collett et al. 1986). Specifically, the animal’s current position may be defined with respect to a landmark (a “seen” vector), and this is compared to a “stored” or remembered vector, which provides the position of the goal with respect to the landmark. The animal can then compute a direct path (i.e., shortcut) by taking the difference between the two, which will enable the navigator to plan an intended path trajectory to a goal (i.e., a movement vector [Cheng 1986; Collett et al. 1986]). Behaviorally this model is attractive but, similar to other associative learning accounts, it lacks a detailed neural mechanism.
By varying the locations of the cues relative to the platform in a water maze task, it may be possible to examine how animals use the cues during place learning and how they determine whether the cues provide task-relevant information. The current study attempts to do this. Figure 1A (inset) shows the location of the hidden platform relative to the cues in the “Near” and “Far” conditions. Therefore, if animals are required to establish distance and directional information from the cues, this should prove more challenging for the Far group, due to the greater distance and angular deviation between the cues and the platform. Therefore, the Far group should be slower at finding the platform. Furthermore, if we observe these animals making an initial movement toward the cues, which is subsequently followed by a redirection toward the platform, this behavior might be indicative of animals using components of the vector model theory (an observed vector, followed by a movement vector). We may also be able to rule out specific elements of the cognitive map theory; for example, if we find evidence of cues being used individually or that the cues are still being used to establish a bearing late in acquisition (when there should be no need for further exploration, as the map should be well established at this stage). This should be particularly evident in the Far condition.
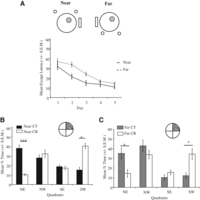
Animals rely on distal cues irrespective of cue location. (A) Decrease in mean escape latency for both the Near and Far-trained groups. (B) Mean percentage time spent in each of the four quadrants of the water maze during the 60-sec retention trial for the Near-control (CT) and Near cue-rotated groups (CR). (C) Mean percentage time in each quadrant of the maze during the retention trial for the Far control (CT) and Far cue-rotated groups (CR). Note, in all conditions animals were put in at the northwest (NW) quadrant, accounting for the high percentage time spent in this quadrant.
There has been some debate over the exact nature of hippocampal involvement in spatial tasks, with suggestions of a hippocampal role in the monitoring of behavior while swimming in the maze. This stems from observations of significant alteration and sometimes extinction of exploratory behaviors following hippocampal ablation (Leaton 1965; Morris et al. 1982; Whishaw et al. 1994; D’Hooge and De Deyn 2001; Wallace et al. 2002). Cognitive mapping theory accounts for this, maintaining that animals would lose the ability to explore efficiently as they would not be able to learn or retain information about the spatial features around them, leaving exploration redundant (O’Keefe and Nadel 1978). Others, however, have proposed that the impairments displayed by lesioned animals are not a purely spatial learning deficit, but rather result directly from the behavioral alterations that occur following hippocampal damage (Eichenbaum et al. 1990; Whishaw 1998; Day et al. 1999). Here we conduct an in-depth behavioral analysis on the role played by the hippocampus in cue-based navigation, and attempt to relate our findings to the above discussion and to the various models of learning.
Results
Animals rely on distal cues to find the goal irrespective of cue location
Animals were randomly divided into two groups and trained in the water maze (four trials/day for 5 d) under either a Far (n = 14) condition or a Near (n = 14) condition (Fig. 1A inset). Figure 1A demonstrates that both Near and Far groups readily acquired the task following training. An overall significant effect for Day was found (F(4,108) = 43.5, P < 0.001), with Bonferroni-corrected t-tests showing the escape latencies on Days 4 and 5 were significantly faster than on the other three days. In addition, an overall significant Group (F(1,27) = 14.285, P < 0.01) effect was found but no Group × Day interaction effect (F(4,108) = 2.126, P = 0.082) was noted. However, to demonstrate that, irrespective of cue distance and location, all animals relied on the distal cues to solve the task, we retested both groups in a probe trial. Prior to the retention test, we divided those animals trained under the Near condition into two further groups: one group (n = 7) was retested in the exact same condition as during training (but with the platform removed; Near CT); the second group (n = 7) was retested (also without the platform, but with the cues rotated 180°; Near CR). Likewise, we divided those animals trained under the Far conditions into two similar groups: group 1 (n = 7) was retested in the exact same conditions as during training (but with the platform removed; Far CT); the second group (n = 7) was retested with the cues rotated 180° (Far CR).
Figure 1, B and C, demonstrates that all groups retained a strong cue–platform association. A repeated measures ANOVA revealed an overall significant Quadrant effect for the Near CT group (F(3,18) = 9.67, P = 0.001) (Fig. 1B, black bars), with subsequent Bonferroni-corrected pairwise comparisons revealing that animals in this group spent significantly more time searching in the northeast (NE) quadrant (38.05 ± 3.4%) than in the southeast (SE) (18.76 ± 1.74%) or southwest (SW) (15.24 ± 2.82%) quadrants (P < 0.05). In contrast, the white bars in Figure 1B show that the Near CR group followed the cues and searched in the SW quadrant. A repeated measures ANOVA confirmed this, revealing an overall significant effect for Quadrant (F(3,18) = 18.56, P < 0.001), with animals searching significantly more in the SW quadrant (40.33 ± 2.93%) compared to the NE (10.29 ± 1.07%) and SE quadrants (17.14 ± 1.97%; Bonferroni-corrected P < 0.05). Further independent t-tests indicated that the Near CT group spent significantly more time in the NE quadrant compared to the Near CR group (t(12) = 7.78, P < 0.001). In contrast, the Near CR group spent more time in the SW quadrant compared to the Near CT (t(12) = 6.17, P < 0.001).
A similar pattern was observed with the two groups trained with the cues located in the Far position. Figure 1C (gray bars) shows that the Far CT group spent most of the time searching in the NE quadrant. A repeated measures ANOVA showed an overall effect for Quadrant (F(3,18) = 9.41, P < 0.001), with subsequent Bonferroni-corrected tests revealing that animals spent significantly more time in the NE quadrant (35.04 ± 5.9%) compared to the SW (12.01 ± 2.84%, P < 0.01) and SE quadrants (10.08 ± 2.96%, P < 0.05). In contrast, the white bars in Figure 1C show that the Far CR group followed the cues and searched mainly in the SW quadrant, with a repeated measures ANOVA revealing an overall significant effect for Quadrant (F(3,18) = 5.17, P < 0.01). Further independent t-tests showed, as expected, that the Far CT group spent significantly more time in the NE quadrant compared to the Far CR group (t(13) = 2.84, P < 0.05).
Do animals use distal cues as a guide and how is this achieved?
While animals retained an association between the distal cues and the platform’s location, we wanted to investigate whether the Near and Far groups differed in terms of their acquisition. Thus, in a second experiment, we trained another set of animals in the water maze for 5 d under either the Near or Far condition (n = 7/group). Both groups successfully acquired the task, but we found that the Far group was significantly slower (25.49 ± 3.89 sec) in finding the platform compared to the Near group (19.31 ± 2.70 sec), as hypothesized. A 2 × 5 mixed factorial ANOVA confirmed this, showing a significant main effect for Day (F(4,48) = 24.04, P < 0.001) and Group (F(1,12) = 5.27, P < 0.05), but no Day × Group interaction effect (F(4,48) = 0.66, P > 0.05). This finding, however, does not demonstrate how animals use the cues and how distance and directional information is established.
To show this, we then analyzed individual tracks from both groups across the acquisition period. From this micro-analysis, a number of cue-related behaviors were observed (Fig. 2; Materials and Methods; Harvey et al. 2008). Initially, both groups swam at the pool side in a thigmotaxic fashion that decreased with time. A 2 × 5 mixed factorial ANOVA confirmed an overall effect for Day (F(4,48) = 10.97, P < 0.001), with Bonferroni-corrected t-tests revealing an overall significant decrease in time spent in thigmotaxic behavior on Days 3, 4, and 5 compared to Day 1 (all P < 0.05). However, no Group (F(1,12) = 2.4, P > 0.05) or Day × Group (F(4,48) = 1.63, P < 0.05) interaction effect was found. Animals showed two types of thigmotaxic behavior; one in which they swam parallel to the pool wall (parallel thigmotaxis) and another where animals swam facing the wall (vertical thigmotaxis). Although there were no significant differences between the groups in the mean time spent in these behaviors (F(1,12) = 0.39, P > 0.05 and F(1,12) = 2.69, P > 0.05 for parallel and vertical thigmotaxis, respectively), Figure 2A demonstrates that animals in both groups show strong vertical thigmotaxis at their respective cues (particularly on Days 1 and 2), suggesting that all animals rapidly associated the cues with an escape. Therefore, it was not simply a case of swimming toward the uncued area for the Far group. We find that this pattern is not observed in Near or Far animals that have been exposed to a pool in which there was no platform present (Supplemental Fig. 1). These findings suggest that during the initial stage of learning animals have formed an association between the cues and an escape. The cues act as a beacon, toward which they search.
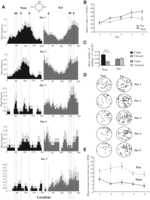
Animals show cue-dependent learning. (A) Mean frequency (±SEM) spent in vertical thigmotaxis behavior at each location (degrees) around the water maze for the Near (black) and Far (gray) groups for each day. Location of cues for both conditions is also illustrated. Note the change in scales on the graphs, reflecting that the time spent in thigmotaxis decreased with learning. (B) Mean percentage time spent along a straight path across the 5 d of training for the Near and Far groups with C highlighting the increase in direct heading toward the cued area (60°–240°) in the Near group but not the Far group (240°–60°) on Day 5. (D) Distribution of Near and Far turns away from the cues throughout training, with E illustrating the mean number of turns away from the cues for both groups on each training day.
However, as the platform was not located at the cues but at a given direction and distance from them, we suggest that animals must then use the cues as a guide. Due to the location of the cues behind the platform, animals in the Near group (upon approaching the platform) can maintain at least one cue within their visual field. This occurs when the animal swims in >64% of the arena. Being able to visualize at least one cue should allow the Near group to be guided more readily, culminating in quicker latencies. In contrast, animals in the Far group, upon approaching a cue, would then have to physically turn around to locate the platform, resulting in longer escape latencies. Figure 2, B–D, supports these ideas.
Figure 2B demonstrates that, although both Near and Far groups spent an increasing amount of time along a direct path as training progressed, the Near group spent more time (39.44 ± 4.1%) in a straight route compared to the Far group (30.63 ± 2.87%). A 2 × 5 mixed factorial ANOVA confirmed this, with an overall effect for Day (F(4,48) = 10.54, P < 0.001) and Group (F(1,12) = 12.14, P < 0.01). No Day × Group interaction effect was found (F(4,48) = 1.85, P > 0.05). We then examined the direction toward which animals swam when performing direct movements (Fig. 2C). The mean number of times each group spent directly swimming in a certain direction or toward a defined region of the pool was calculated. As this behavior was not performed as readily as thigmotaxis, the pool was divided into two segments, with one segment containing cues and the other containing no cues. The cue-containing area for the Near group encompassed the region from 60° to 240° and for the Far group encompassed the area from 240° to 60°. The non-cued area for the Near group encompassed the region from 240° to 60°, and for the Far group included the area from 60° to 240°. Analysis revealed that the Near group spent significantly more time heading toward the cued area than toward the non-cued region of the maze (t(6)= 2.32, P < 0.01; t(6) = 4.47, P < 0.01; t(6)= 5.62, P < 0.001; t(6) = 11.6, P < 0.001 for Days 2–5, respectively). In contrast, the Far group did not appear to have any significantly preferred heading direction across training (Day 1, t(6) = 1.46, P > 0.05; Day 2, t(6) = 1.19, P > 0.05; Day3, t(6)= 0.75, P > 0.05; Day4, t(6) = 0.40, P > 0.05; Day 5, t(6) = 0.77, P > 0.05). Figure 2C shows data for Day 5 only. This suggests that the Far group did not swim along a direct trajectory and spent a similar amount of time heading toward the cues as away from them, across training.
This idea is developed further when we analyzed the mean number of turns away from the cues. Figure 2, D and E, shows that the Far group made significantly more turns away from the cues across all days compared to the Near group. A 2 × 5 ANOVA confirmed this by revealing no overall significant effect for Day (F(4,48) = 2.01, P > 0.05). However, a main effect for Group was found (F(1,12) = 67.46, P < 0.001), where the Far group made significantly more turns away from the cues (10.8 ± 1.33) than the Near group (4.54 ± 1.04 (Fig. 2D,E). Furthermore, this group showed a significant heading, after the turn, toward the platform (F(1,12)= 109.6, P < 0.01). This indicates that the Far group approached the cues to get bearings before turning in the correct direction, suggesting that the cues are providing directional information. With time, the locations of turns get closer to the platform (Fig. 2D) suggesting that animals no longer need to swim directly toward the cues and that distance information has been established.
Using a dynamic model of spatial navigation we recently developed (Fey et al. 2011), some of these findings were tested. Using the model (Fig. 3A) we were able to separate out different learning strategies and compare the resulting escape latencies to our experimental data. For example, Figure 3B demonstrates that if animals select a random cue (located in the Far position), swim toward it, and continue to repeat this strategy until the platform is found (F CA), the resulting escape latencies are very high (∼52 sec, similar to that observed behaviorally on Day 1). If animals approach a cue (again, located in the Far position), turn, and head in a random direction (F CA-RND), this behavior reduces the escape latencies to ∼39 sec. Similarly, if animals approach a cue and turn in the exact direction from where they came (F CA-180), the escape latencies also remain high (at ∼35 sec). However, if animals approach a cue (in the Far position) and turn in the direction of the platform, their escape latencies drop to ∼20 sec (CA-DC). Furthermore, when animals use this last strategy but learn to limit their cue approach (as was observed in the behavioral data above, with turns getting closer to the platform), their escape latencies dropped to a figure similar to that we have observed experimentally (DC, 13.9 sec in the model vs. 14.1 ± 2.8 sec in the experimental data on Day 5). Figure 3C models this strategy further and shows how escape latencies can decrease by simply reducing the number of steps/distance taken toward the cues.
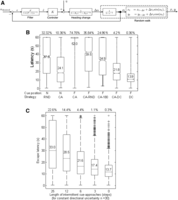
(A) Schematic overview of the model describing the rat’s swimming dynamics in the Morris Water maze. x, y is the rat’s location, α is the rat’s actual heading, αdesired the rats desired heading, e the heading error, ê the rat’s estimate of the heading error, and η and Δrt the Gaussian and Rayleigh distributed random variables, respectively. The variable z arises from the z-Transform of the system, and can be understood as a time shift operator, i.e., z−ix(t) = x(t − i Δt). The model parameters F, K, A1, and A2, and the distributions of η and Δrt have been identified earlier (see Fey et al. 2011 for further details). (B) Using the dynamic model to analyze the effectiveness of different strategies. Distribution of mean (number) and median (line) escape latencies and % unsuccessful trials in various groups: (N RND) random swimming movements, (CA) approach a cue in Near (N) or Far position (F), (F CA-RND) approach a cue in Far position and turn away into a random direction, (F CA-180) approach a cue in Far position and turn away at 180°, (CA-DC) approach cues in Far position and turn away with directional error, (DC) approach cues in Far position on first trial only and turn away from cues with directional error. See Methods for details on all groups. (C) Modeling the effect of decreasing the number of steps that an animal swims toward the cues ncue (for 30° directional uncertainty and zero distance uncertainty) on escape latency. Therefore, as an animal learns the location of the platform relative to the cues, it does not need to keep approaching the cues, rather it can start moving directly toward the platform location. The figure shows this idea. Animals alternate between swimming toward the cues (in order to orientate—this parameter changes from 25 steps to 0 steps) and swimming into the direction of the platform (in order to escape—this parameter remains constant). Note, a step of 25 indicates an animal swimming toward the cue, and 0 indicates a minimum movement toward the cues.
A strategy of heading toward the cues, turning away, and heading in the direction of the platform is one strategy adopted, but we also observed a more efficient method of cue guidance, particularly relevant for the Far group. This emerged from our analysis of turns toward the cues. Although the mean number was similar for both groups (12.17 ± 0.67 (Near) and 10.17 ± 0.67 (Far)), the location of where the turns occurred differed. Figure 4A demonstrates the mean location of turns in the Near group remained stable across time with turns toward cue 1 (blue), cue 2 (red), and cue 3 (green) being 41.17°, 315.5°, and 255.2°, respectively, on Day 5. Thus, the turns toward a specific cue tended to be located opposite the cue itself, thereby increasingly the chance of the animal finding the platform. In contrast, the Far group’s mean location of turns changed with time and became increasingly clustered north of the platform by the final training day (Fig. 4B). The mean location of turns toward cue 1 (blue), cue 2 (red), and cue 3 (green) on Day 5, for example, was 214.6°, 132.6°, and 337.1° relative to the platform, respectively. Therefore, the mean location of turns changed gradually from being at the cues on Day 1 to opposite the cues by Day 5, thereby allowing animals to approach the platform while maintaining at least one cue within their visual field (as for the Near group). Furthermore, for both groups the location of turns got closer to the platform over time, although at a slower pace for the Far group (Fig. 4C,D). A 5 × 3 repeated measures ANOVA examining turn location for the Near group revealed no significant main effect for Day (F(4,24) = 1.07, P > 0.05); however, a significant main effect for Zone was revealed (F(2,12) = 20.33, P < 0.001), where the overall mean number of turns in the Far zone was significantly higher (M, 8.17 ± 1.27) than in the Middle (M, 5.2 ± 1.21, P < 0.01) and Near zones (M, 4.15 ± 1.11, P < 0.01). A significant interaction effect between Day and Zone (F(8,48) = 3.30, P < 0.01) was also found. No difference between the zones was noted (F(2,12) = 0.24, P > 0.05) by Day 5 (Fig. 4C) suggesting that all turns were conducted in a similar location. Similar analyses were conducted for the Far group. Overall, no main effect for Day was noted (F(4,24) = 2.54, P > 0.05). A main effect for Zone was found (F(2,12) = 66.31, P < 0.001) with subsequent Bonferroni-corrected t-tests illustrating the highest mean number of turns were in the Far zone. In addition, an interaction effect between Zone and Day was also noted (F(8,48) = 18.95, P < 0.05). A significant difference was noted between the zones on Day 5 (F(2,12) = 9.16, P < 0.01), with differences between the Near and Far (P < 0.01) and Middle and Far zones (P < 0.01).
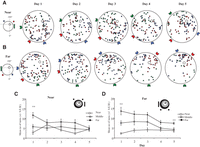
Distribution of an animal’s turns toward the cues (color coded, see insets) in the Near condition (A) and in the Far condition (B). The mean turn location tended to be opposite the cue itself. For example, the blue cue in the Near condition is at 240° relative to the platform but the mean location (blue block arrows) of turns toward this cue occurred around 20°–40°. Note also the increasing cluster of turns closer to the platform as learning progresses (especially on Day 5). (C) Mean number of turns (±SEM) in the Near, Middle, and Far zones during acquisition training for the Near group. (Inset) Schematic representation of the three zones used for analysis. (D) Mean number of turns (±SEM) in the Near, Middle, and Far zones during acquisition training for the Far group.
Overall, these results suggest that animals need to visualize the cues and use individual cues to guide them to the goal. These findings suggest a visually dependent guidance mechanism that speaks more to an associative account of spatial learning (Chamizo and Rodrigo 2004; Chamizo et al. 2006) than to a cognitive map per se. Animals need to visualize the cues to evoke a particular direction and distance.
Separating the contribution of directional and distance knowledge to the learning process
While it may be considered that successful navigation depends on the contribution of both distance and directional information, this contribution may not be equal. Using our model, we were able to separate the contribution of directional and distance information by either reducing the directional uncertainty (σ_direction) or the distance uncertainty (σ_steps) following a cue turn and comparing the resulting escape latencies. Figure 5A demonstrates the distributions of escape latencies and percentage of unsuccessful trials in response to decreasing distance uncertainty (while keeping the directional uncertainty constant at 30° [i.e., animals essentially know the direction to the platform]). Figure 5B shows the distributions of escape latencies in response to decreasing the directional uncertainty σ_direction while keeping the distance uncertainty constant (zero distance uncertainty). Note that in all simulations rats approach cues during the first swimming episode only (ncue = 0). In this model, loss of direction seemed to affect escape latencies more than loss of distance. This can be seen more clearly in Figure 5C which shows the distribution of escape latencies resulting from different combinations of both directional and distance uncertainties using 2500 simulated trials (see table). The surface of Figure 5C represents a smooth fit to these data with the solid lines (isoclines) marking equal escape latencies and the dashed lines representing two possible learning curves that depend on the extent of distance or directional information acquired.
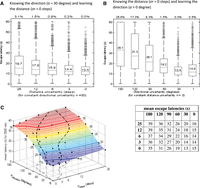
(A) Distributions of escape latencies in response to decreasing distance uncertainty (for 30° directional uncertainty rats approach cues in the first swimming episode only, ncue= 0). (B) Distributions of escape latencies in response to decreasing directional uncertainty σdirection (for zero distance uncertainty rats approach cues during the first swimming episode only, ncue = 0). (C) Escape latencies resulting from different combinations of directional and distance uncertainties. (Black dots) The mean escape latencies of 2500 simulated trials (see table); the surface of Figure 5C represents a smooth fit to these data. (Solid lines) Equal escape latencies (isoclines), (dashed lines) two possible learning curves.
Does cue location affect hippocampal functioning?
Following our behavioral analysis, we then wanted to examine the role of the hippocampus in cue-dependent learning. As our results suggested that animals in both Near and Far groups use a similar learning mechanism (albeit at a slower rate for the Far group), we would expect that hippocampal lesions would have similar effects on both groups. To examine this we trained two groups of animals (Sham and Dorsal Hippocampal lesion [DH]; n = 8/group) in the MWM with cues located in the Near position and a further two groups (Sham and DH; n = 7/group) to find the platform using cues located in the Far position. We demonstrate that both DH groups were significantly impaired at finding the hidden platform compared to their respective sham controls (F(1,14) = 12.59, P < 0.01 [Fig. 6A] and F(1,13) = 17.92, P = 0.001 for Near and Far groups, respectively; Morris et al. 1990; de Bruin et al. 2001). When we compared the two lesioned groups directly, we found that the Near DH group had an overall mean escape latency of 38.61 ± 5.75 sec and the Far DH group had a mean of 46.29 ± 3.81 sec. A 2 × 5 mixed factorial ANOVA revealed an overall effect for Day (F(4,52) = 4.91, P < 0.01), with Bonferroni-corrected pairwise comparisons revealing significantly shorter escape latencies on Day 5 compared to Day 1 (P < 0.05), suggesting that as training progressed some improvement in task performance occurred. However, there was no significant difference seen between the two lesioned groups (F(1,13) = 2.03, P > 0.05). Further, no Group × Day interaction effect was observed (F(4,52) = 0.99, P > 0.05). There was also no significant difference between the groups in the retention probe task (t(13) = 1.77, P > 0.05). These results suggest that both lesioned groups, having similar levels of hippocampal damage (Supplemental Fig. 2) and irrespective of cue location, performed at a similar level.
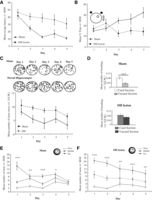
Contribution of the dorsal hippocampus to cue guidance. (A) Mean escape latency for the sham and DH lesioned animals throughout five training days (in Near condition). (B) Mean percentage time spent in direct behavior throughout training for the sham and DH animals. (C) The position of turns away from the cues throughout training for the sham and DH lesioned animals (upper), and the mean number of turns away from the cues across the 5 d for both groups (lower). (D) Mean number of direct behaviors toward either the cued (60°–240°) or uncued (240°–60°) portion of the water maze for the sham (upper) and DH lesioned (lower). (E) Mean number of turns (±SEM) in the Near, Middle, and Far zones during acquisition training in the Sham group with a reduction of turns in the Far zone and an increase of turns in the Near zone as animals learned the task. (Inset) Schematic representation of the three zones used for analysis. (F) Mean number of turns (±SEM) in the Near, Middle, and Far zones during acquisition training for the DH lesioned group.
How does the hippocampus contribute to cue-dependent learning?
We demonstrate that both hippocampal groups have common impairments, indicating an inability to quickly inhibit maladaptive behaviors and cue-guidance difficulties. Initially, lesioned animals displayed a greater amount of thigmotaxis and failed to reduce this as rapidly as shams. While both lesioned and non-lesioned animals displayed vertical thigmotaxis at the cues, suggesting that lesioned animals still recognize that cues have a value, lesioned animals maintained this behavior for longer (F(1,13) = 14.93, P < 0.01). Supplemental Figure 3 shows, for the most part, vertical thigmotaxis for both Near and Far lesioned groups occurred at the cues.
As animals learned the task (especially for the Near group), we observed that they stayed on straighter trajectories for longer, heading toward the cues before readjusting their position, with turns getting progressively closer to the platform with time (Figs. 2B,C and 4C, respectively). Animals with hippocampal lesions, however, have major navigational problems. First, hippocampal animals are unable to maintain a direct path. Figure 6B shows that the mean percentage time spent by sham animals in direct behavior increased with continued training (F(4,28) = 5.39, P < 0.01), but this was not replicated in the lesioned group (F(4,28) = 1.82, P > 0.05). A 2 × 5 mixed factorial ANOVA confirmed these findings, demonstrating no overall effect for Day (F(4,56) = 1.78, P > 0.05) but a significant Group effect was found (F(1,14)= 1.82, P < 0.05), with sham animals (22.86 ± 3.09%) spending significantly more time in direct behavior than the hippocampal lesioned animals (16.17 ± 1.62%). An interaction effect between Day and Group (F(4,56) = 5.8, P < 0.001) was also noted with further independent t-tests revealing differences between the groups on Day 3 (t(14)= 3.20, P < 0.01) and Day 5 of training (t(14)= 3.17, P = 0.01).
Second, as a result of not staying on a direct trajectory, we observed that lesioned animals turned away from the cues significantly more (F(1,14) = 10.05, P < 0.01) (Fig. 6C) and headed back toward the uncued section when compared to shams. Figure 6D, for example, shows that the sham group headed significantly toward the cued region compared to the uncued region on Day 5 (t(7) = 7.17, P < 0.001), whereas the DH group did not (t(7) = 1.12, P > 0.05).
Third, the majority of turns for the lesioned animals were located at the pool periphery (Fig. 6F) rather than moving gradually closer to the platform as was observed for the sham animals (Fig. 6E). A 3 × 5 repeated measures ANOVA was initially conducted to assess the mean number of turns made in each zone, throughout training, for sham animals (Fig. 6E). No overall effect for Day was found (F(4,28) = 2.92, P > 0.05). However, a main effect for Zone was revealed (F(2,14) = 50.19, P < 0.001), with subsequent Bonferroni corrections illustrating the highest mean number of turns occurred in the Far zone (9.07 ± 1.24), which was significantly higher than in both the Near (3.33 ± 0.54, P < 0.001) and Middle zones (5.57 ± 0.96, P < 0.01), overall. There was also a Day × Zone interaction effect (F(8,56) = 5.01, P < 0.001). When studied in more detail, using daily one-way repeated measures ANOVAs, a significant difference between the zones on Day 1 (F(2,14) = 24.31, P < 0.001), Day 2 (F(2,14) = 9.87, P < 0.01), Day 3 (F(2,14) = 23.83, P < 0.001), and Day 4 (F(2,14) = 6.57, P < 0.05) was revealed. Importantly, no difference was noted between the zones by Day 5 (F(2,14) = 1.28, P > 0.05), suggesting that sham animals were getting closer to the platform.
A 3 × 5 repeated measures ANOVA was also conducted for the lesioned animals (Fig. 6F), and this also revealed no overall effect for Day (F(4,28) = 2.37, P > 0.05). However, a main effect for Zone (F(2,14) = 29.04, P < 0.001) and a Day × Zone interaction effect was found (F(8,56) = 3.26, P < 0.01). Subsequent Bonferroni-corrected t-tests revealed that the highest mean number of turns was in the Far zone (12.90 ± 1.91), which was significantly higher than in both the Near (2.71 ± 0.67, P < 0.001) and Middle zones (6.92 ± 1.62, P < 0.05), overall. Further comparisons using a one-way repeated measures ANOVA revealed differences between zones on Day 1 (F(2,14) = 26.86, P < 0.001), Day 2 (F(2,14) = 42.35, P < 0.001), Day 3 (F(2,14) = 8.26, P < 0.01), Day 4 (F(2,14) = 11.31, P < 0.001), and Day 5 (F(2,14) = 8.77, P < 0.01), suggesting that the DH group did not turn closer to the platform, despite continued training in the maze. We note that these findings were irrespective of cue location (Supplemental Fig. 4).
Discussion
Overall our results suggest that animals use distal cues in a visual-dependent guidance manner. This is a gradual process, whereby animals initially swim at the cues, but with training animals make very precise cue-dependent turns closer to the platform, while attempting to keep the cues within their visual field. Note that despite the wide visual field that rats can see (de Araujo et al. 2001), due to their poor acuity (Prusky et al. 2002) and poor depth perception (Heffner and Heffner 1992), animals may still need the cues to fall on the central visual field. If it is not possible to keep the cues directly within the visual field (as with the Far group), animals can turn (using the cue) and head in the correct direction, and then maintain this direction for a certain distance, possibly by path integration (Collett and Graham 2004). The use of path integration is, however, limited by the reduction in the animals’ need to approach the cues (i.e., turns away from cues getting closer to the platform) and their increased use of cues as a guide (turning in locations where cues fall on their visual field). This strategy, combined with increased distance and directional accuracy (both of which may not contribute equally), allows an animal to rapidly learn the task. The idea of cue visualization to evoke directional and distance information is similar to that suggested by the vector model (Collett et al. 1986). Although rarely applied to mammalian navigation, this model suggests that animals can use multiple cues in the form of vectors to guide them to a goal. A vector, in this instance, incorporates both distance and direction information of the landmark’s location to a goal, and will enable shortcuts to be made once a vector is established. The idea of multiple heading vectors rather than a single map provides a more comprehensive account of learning in the MWM, as it takes into consideration the fact that navigating animals are likely going to use some landmarks on certain trials and others on other trials (Pearce et al. 2004), as well as allowing some cues to become more dominant than others (cue competition; Sanchez-Moreno et al. 1999).
While the hippocampus has been the center of cognitive mapping theory, our behavioral findings do not fit with the proposal that when the hippocampus is destroyed, all exploratory behaviors should disappear (O’Keefe and Nadel 1978; Morris 1984). We have observed in the lesioned animals that the cues still hold a value (thigmotaxis at the cues) and that they may provide some cue directional information (turns toward the cues at the periphery were at similar locations to those of the shams). But these animals are clearly impaired—what is the nature of this impairment? Our data indicate that the hippocampus is involved in reducing thigmotaxic behavior, as well as using the cues as a visual guiding mechanism, i.e., as a guide toward the platform and not the cues, thereby requiring precise directional and distance information. Thus, the debate surrounding the function of the hippocampus, implicating it in the monitoring of navigation behavior, fits with our suggestion of the use of a heading vector in the MWM. Specifically, as vectors are used to calculate distance and direction to a goal from landmarks, the understanding that the cues hold value, the inability to maintain a path, alongside the difficulty to use the cues effectively in appropriate locations, seen in our lesioned animals, supports this idea.
The recording of place cells in the hippocampus originally has been taken as evidence for the hippocampus as the center of a cognitive map (O’Keefe and Dostrovsky 1971; Muller and Kubie 1987), but it has, recently, been noted that place cells may not fully account for, or represent, an entire environment. Instead, they have been shown to fire and encode previous or, importantly, anticipated locations (Bower et al. 2005; Ainge et al. 2007). This may highlight the need for the hippocampus in the planning of future situations, which also corresponds with the idea of Collett et al. (1986) that animals, when navigating, plan their path trajectory from a start point by using heading vectors. The current data are also in accordance with the idea that the animal can learn to associate its current position with its next choice of goal-directed behavior. For example, once an intact animal perceives the cues in a particular part of the environment, where they know their relation to the platform’s position, the goal can be found; a strategy that the lesioned animals are clearly unable to effectively use. An extended vector model proposed by Kubie and Fenton (2009), that emphasizes the use of head-direction cells as a guide during route execution rather than place cells, may also be consistent with our findings. The authors’ suggestions that optimal routes are straight line paths, that a naive animal moves along walls between prominent landmarks, and that animals do not need to constantly track their current location but only require directional and distance information at key locations, are also consistent with our behavioral and computational findings. Overall, our findings contribute to the current theoretical debate on spatial learning, and may go toward the development of a model of hippocampal-dependent navigation that is based on a cue guidance mechanism consistent with the heading vector model.
Materials and Methods
Subjects
Seventy-two male Wistar rats (250–350 g, Harlan UK), aged ∼3 months old, were used as subjects in all experiments. Animals were housed three per cage in a temperature-controlled environment (21 ± 1°C), which was maintained on a fixed 12:12-h light–dark cycle (07.00–19.00 h). The rats had no prior exposure to the maze and were experimentally naive. Guidelines for the maintenance and experimentation of animals conformed to the Department of Health and Children (Ireland) guidelines and European directive 86/609/EC.
Apparatus
The Morris water maze was used in all behavioral experiments. It was a uniformly black, circular fiberglass pool (170 cm in diameter, 36 cm deep). The maze was filled with water to a depth of ∼21 cm and kept at a temperature of 20 ± 1°C. A removable black concrete platform (11 cm diameter, 19 cm height) located in the northeast quadrant of the pool, for all conditions, was used by animals to escape the water. The platform was submerged 2 cm below the water surface, rendering it invisible to the rats when swimming. The pool was surrounded by a black curtain which was located ∼50 cm from the pool wall. This provided a uniform background around the entire pool. Three distal cues were located at fixed positions around the maze. The distal cues included two 25-W light bulbs suspended from the ceiling. Both lights were located on the inside of the surrounding curtain at a distance of 75 cm from the pool at an angle of ∼60°. A rectangular sheet of white paper (55 cm × 81 cm) was also attached to the curtain for use as a cue. The position of the distal cues, as well as of the hidden platform, remained fixed throughout acquisition of the task. Two cue positions were used throughout training. The Near training condition had three distal cues located around the pool, including a light cue positioned in the northwest (NW) quadrant and the northeast (NE) quadrant and a white sheet of card at the east (E) of the pool. The nearest cue (NE light cue) was positioned 120 cm from the platform. The Far training condition involved the distal cues being placed in a location farther away from the hidden platform. In this condition a light cue was positioned in the southwest (SW) quadrant and the southeast (SE) quadrant, and a white sheet of card was located to the west (W) of the pool. The furthest cue (SW light cue) in this condition was positioned 220 cm from the hidden platform. EthoVision (Noldus Information Technologies) digital tracking system recorded escape latencies, distance traveled, and swimming velocity of each animal on all trials.
Training and retention procedure
Animals were trained for five consecutive days (four trials/day). Each acquisition trial consisted of the animal being placed into the water maze for 60 sec, at one of four pseudo-random points around the pool (N, S, E, and W). If, after the maximum allocated time, the animal had not found the escape platform it was guided to its position by the experimenter. The rat was allowed to remain on the platform for 15 sec followed by an inter-trial interval of 10 sec, when they were placed in an open topped container outside the pool’s vicinity. The three distal cues, for both groups, were visible throughout all of the acquisition trials and platform intervals. Throughout training gross measures of performance were recorded, such as escape latency and distance moved. In addition, the swimming behaviors of the animals were also recorded for later analysis. This was achieved using a second camera (Sanyo high-resolution b/w CCD camera 1–1.3 mm, 5–50 mm) placed directly above the pool in the laboratory ceiling. If retention was assessed, a retention trial was carried out 7-d post-acquisition during which the platform was removed from the pool and all animals were placed in the maze from the NW quadrant and allowed to swim for 60 sec. Measures of retention included mean percentage time (of the 60 sec) spent swimming by groups in each of the four quadrants of the pool. While a 24-h retention test has been used by many research groups, we have traditionally found, over years of testing, the use a 7-d probe test to be a more robust measure of retention (e.g., Commins et al. 2003; McGauran et al. 2004; McGauran et al. 2005; Harvey et al. 2008).
Behavioral analysis
Measurement of searching strategies used during in-trial locomotion
The swimming behaviors of all rats were also examined for each training trial. EthoVision provided x, y coordinates (0.2 sec increments apart) for the animal’s position throughout each trial. From visual inspection of recorded video files and detailed analysis, a number of distinct behaviors emerged. These observed behaviors were analyzed for every training trial, under a number of categories including: percentage time spent (of total time in the pool) of each behavior, and the frequency of each behavior at individual locations in the maze (i.e., 0°–360°). Examples of such behaviors included thigmotaxis, direct movement, and turns toward and away from the cues (see Harvey et al. 2008 for more details). Thigmotaxis was characterized by the animal moving almost exclusively at the periphery of the maze. Within this category two subclasses were evident: parallel thigmotaxis and vertical thigmotaxis. Parallel thigmotaxis referred to animal movements alongside the maze wall, with the animal remaining within 10 cm of the pool’s edge. Vertical thigmotaxis was characterized by animal movements facing the pool wall; the animal makes direct contact with the wall of the arena while continuing to move around the periphery of the maze. Direct behavior was characterized by animal movements in a straight, definite direction over a minimum period of 1 sec. A turn was considered a whole body turn and not just that of the animal’s head. For this, the animal moved in one direction followed by an obvious change in orientation (>50°) and movement in a second direction. Therefore, turning is the incident of observable angular change between two periods of movement in different directions. Turns were divided into a number of categories; turns toward the cues and turns away from the cues. Turns toward the cues included an animal moving in one direction and turning (change in direction >50°) and heading in a different direction toward a distal cue (range ±30° either side of the cue). A turn away typically involved an animal performing a whole body turn and change in direction (>50°) that is not toward a distal cue; rather, the animals perform turns in a direction away from the distal cues. In order to fully examine turning behavior, each external distal cue was color-coded (blue, red, or green) in the results for ease of analysis.
Zones of the pool
To examine the location of turns made in the maze, the pool was divided into three zones of equal area. For each turn point, a line was drawn between the center of the platform, the turn position, and the pool edge using Adobe Photoshop 5.0. This program measured the length of each line and then normalized the location of the turn on each respective line, giving a percentage position on that line of where each turn point lay (i.e., pool wall was at 100% and platform edge was at 0%). This accounted for unequal distances from the platform to the side of the pool. Three zones were used in order to categorize the location of turn positions in the pool; turns within 0%–33% were in the “near” zone. Turns within 34%–66% were in the “middle” zone. Turns within 67%–100% were in the “far” zones. The mean number and location of turns for each animal was then assessed (adapted from Harvey et al. 2008).
Surgery
Rats were anesthetized with isoflurane gas (1.8%–3.0% isoflurane delivered in O2 at 1 L/min). The animal’s head was then placed in a Kopf stereotaxic frame and the incisor bar was adjusted so that bregma was level with lambda. For dorsal hippocampal lesioned animals, a small burr hole was made (with a small handheld drill) in the skull at each marked coordinate. N-Methyl-D-aspartate dissolved in 0.1 M sterile PBS, pH 7.4 (10 mg/mL NMDA [Sigma-Aldrich]) was injected bilaterally along the longitudinal axis of the hippocampus (following Paxinos and Watson 2005; Bardgett et al. 2006). Solutions were infused with a 5-µL Hamilton syringe over ∼30–60 sec. The needle was left in place for 1 min after each infusion. Buprenorphine (0.3 mg/kg, s.c. [Temgesic]) was given as an analgesic, prior to the cessation of anesthesia. Sham-operated rats were anesthetized in the same manner as above, had their skin and muscles cut, and had two small holes burred in the skull. They were then sutured and administered buprenorphine (0.3 mg/kg, s.c. [Temgesic]); they received no damage to the cortex. Following surgery, animals were placed in an individual recovery cage until they regained mobility. Animals were housed in individual cages for the duration of the experiment. All animals were allowed to recover for 7 d before behavioral testing.
Histological analysis
At the completion of behavioral testing, animals were administered a lethal overdose of sodium pentobarbital (Euthatal, 100 mg/kg i.p.). The brains were then removed and stored in 4% paraformaldehyde dissolved in 0.1 M phosphate buffer (PFA) and later transferred to a 30% sucrose solution and stored at 4°C. Coronal 40-µm thick sections were then cut on a freezing microtome (Leica SM2010R, Leica Microsystems). Every fourth section was mounted on gelatin-coated slides and stained with cresyl violet (Sigma-Aldrich). Images of the stained slices were taken and then transferred to a PC where they were analyzed using a specifically designed Matlab R2008a program. Six sections rostrocaudally, which included two rostral sections at bregma −2.16, two mid sections at bregma −3.12, and two caudal sections at bregma −4.08, were examined for each animal. The area of damaged dorsal hippocampal tissue was measured and expressed as a percentage of the total dorsal hippocampal area taken from the six selected sections. The size of the lesion to each of the subregions within the dorsal hippocampus was also assessed. The size of the area of the intact regions (DG, CA1, and CA3) was calculated at each level for each animal in the sham groups and the area of damage was, similarly, calculated at each level for each animal in both of the DH groups. The extent of subregional damage in each of the DH animals was then presented as a percentage of the intact area for each of the animals in the sham group. Lesions were reconstructed using Paxinos and Watson (2005).
Computational modeling
The effectiveness of different learning strategies was examined using a dynamic model of swimming behavior that we developed recently (Fey et al. 2011). From this, the mean escape latencies and percentage of unsuccessful trials of seven groups were tested. We had a random swim (RND) group and two approach (CA) groups, which consisted of one group swimming randomly to cues located in the Near position (N-CA) and another group swimming randomly to cues located in the Far position (F-CA). For a fourth group, simulated animals approached a random cue (located in a Far position) and then turned away from the cue into a random direction (F CA-RND). Here we allowed αdesired to be the direction to the cue plus a normally distributed random number with a mean of 120° and standard deviation of 180°. For a fifth group, simulated animals approached a random cue (again, located in a Far position) and then turned away at exactly 180° (F CA-180). Here we allowed αdesired to be the direction to the cue + 180°. For a sixth group (CA-DC), simulated animals approached a random cue (in the Far position) and turned away with directional error using steps (1)–(4) as a strategy (below) for each trial. The final group (direct control [DC]) approached cues in a Far position and turned away from them with directional error but omitting step (1) for iteration two and subsequent ones.
-
(1) Swim toward a random cue for a certain amount of steps ncue. Let ncue = 6 for trial 1 (the number of approach steps can be varied; see Fig. 3C).
-
(2) Turn away into direction of the platform + directional error, i.e., the heading is described by αdesired = αcorrect + εdirection where εdirection is a normally distributed random number with mean μ = 0 and standard deviation σdirection. The standard deviation σdirection can be interpreted as the directional uncertainty of the learning process (which can also be manipulated; see Fig. 5B).
-
(3) Swim the distance to the platform + distance error, i.e., the number of steps (into direction αdesired as determined in [2]) is described by n = ncorrect + εsteps, where εsteps is the nearest integer of a normal distributed random number with zero mean and standard deviation σsteps. The standard deviation σsteps can be interpreted as the distance uncertainty of the learning process (see Fig. 5A).
-
(4) Two possible strategies: start again with (1) (CA-DC strategy) or start again with (2) (DC strategy).
Statistics
All linear statistical analysis was carried out using SPSS (version 17). Circular statistical analysis was carried out using Oriana (Version 2.0, Kovach Computing Services). Statistics used included analysis of variance with appropriate Bonferroni pairwise comparisons and independent, dependent, and one-sample t-tests, where appropriate. Rayleigh Uniformity tests (P < 0.05) and Watson–William F-tests were also employed to assess circular data. The symbol ± was employed throughout to indicate standard mean error. Error bars, where present, show standard error of the mean (SEM). A star-based system for significance representing P-values of (*) <0.05, (**) <0.01, (***) <0.001, respectively, was used throughout.
Acknowledgments
We thank J.P. Lowry, F. Bolger, and J. Kealy for technical assistance, and A. Coogan and R. Roche for advice and comments. Also, we thank C. Hasting, A. Stiobhairt, and S. Tomas for help in collecting some of the initial data. The research was supported by the Department of Psychology, NUIM, and the John and Pat Hume scholarship awarded to M.D.
Footnotes
-
↵3 Corresponding author
E-mail sean.commins{at}nuim.ie
-
[Supplemental material is available for this article.]
- Received November 2, 2012.
- Accepted April 6, 2013.
- © 2013, Published by Cold Spring Harbor Laboratory Press
This article is distributed exclusively by Cold Spring Harbor Laboratory Press for the first 12 months after the full-issue publication date (see http://learnmem.cshlp.org/site/misc/terms.xhtml). After 12 months, it is available under a Creative Commons License (Attribution-NonCommercial 3.0 Unported), as described at http://creativecommons.org/licenses/by-nc/3.0/.



