


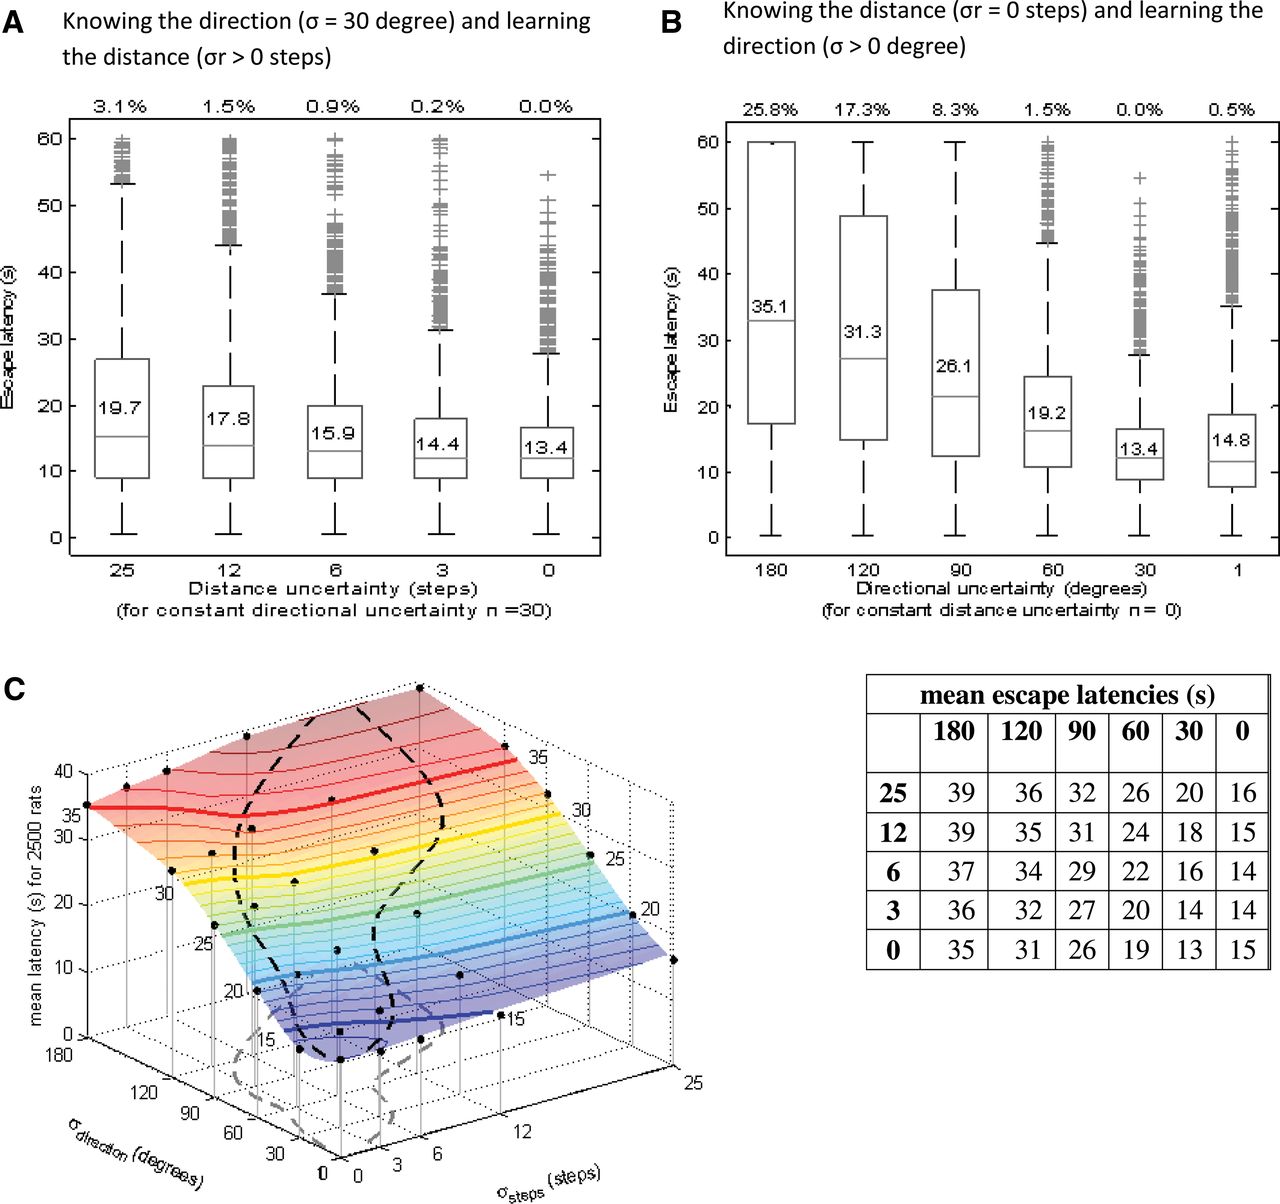
(A) Distributions of escape latencies in response to decreasing distance uncertainty (for 30° directional uncertainty rats approach cues in the first swimming episode only, ncue= 0). (B) Distributions of escape latencies in response to decreasing directional uncertainty σdirection (for zero distance uncertainty rats approach cues during the first swimming episode only, ncue = 0). (C) Escape latencies resulting from different combinations of directional and distance uncertainties. (Black dots) The mean escape latencies of 2500 simulated trials (see table); the surface of Figure 5C represents a smooth fit to these data. (Solid lines) Equal escape latencies (isoclines), (dashed lines) two possible learning curves.



