


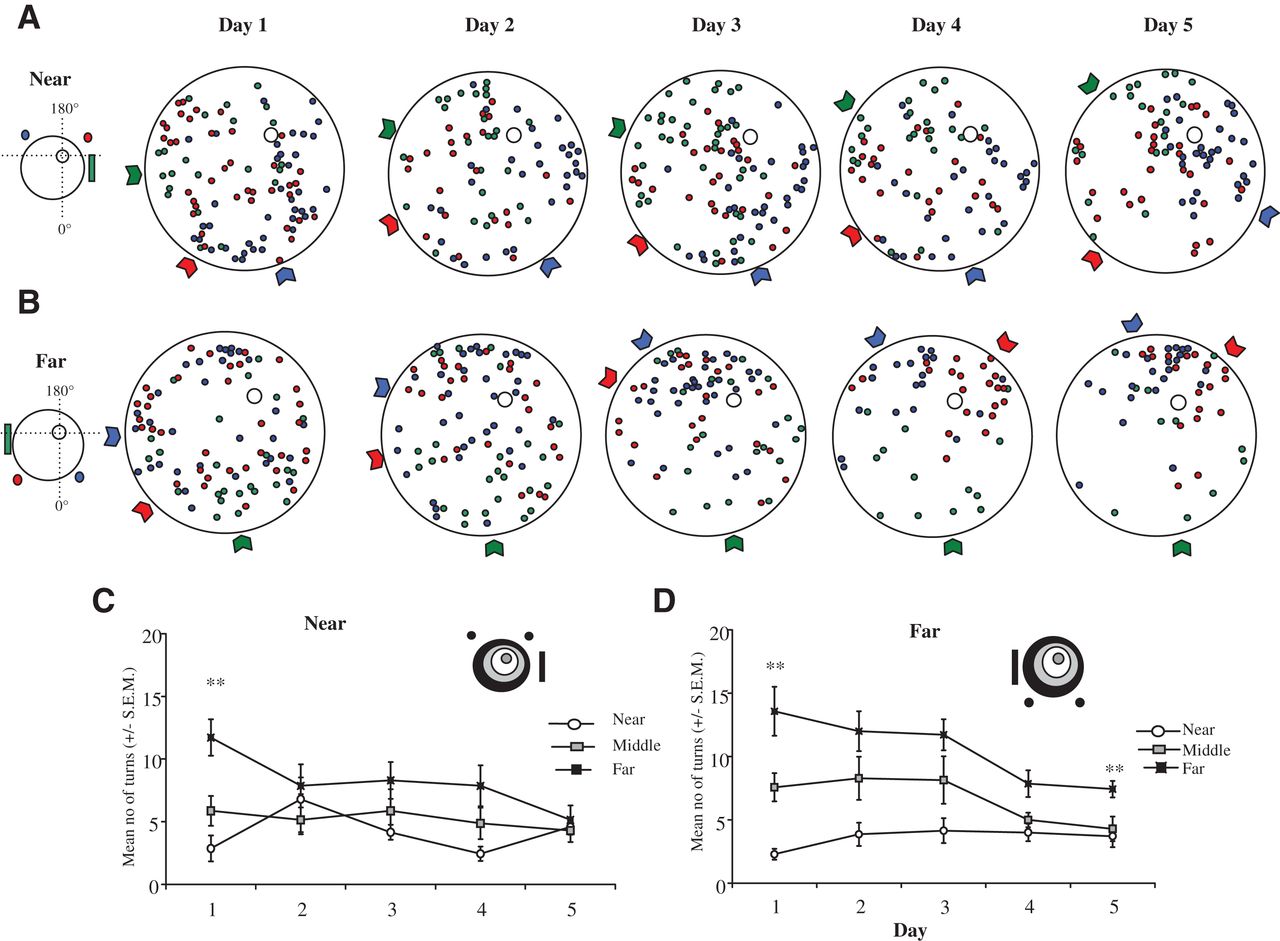
Distribution of an animal’s turns toward the cues (color coded, see insets) in the Near condition (A) and in the Far condition (B). The mean turn location tended to be opposite the cue itself. For example, the blue cue in the Near condition is at 240° relative to the platform but the mean location (blue block arrows) of turns toward this cue occurred around 20°–40°. Note also the increasing cluster of turns closer to the platform as learning progresses (especially on Day 5). (C) Mean number of turns (±SEM) in the Near, Middle, and Far zones during acquisition training for the Near group. (Inset) Schematic representation of the three zones used for analysis. (D) Mean number of turns (±SEM) in the Near, Middle, and Far zones during acquisition training for the Far group.



