


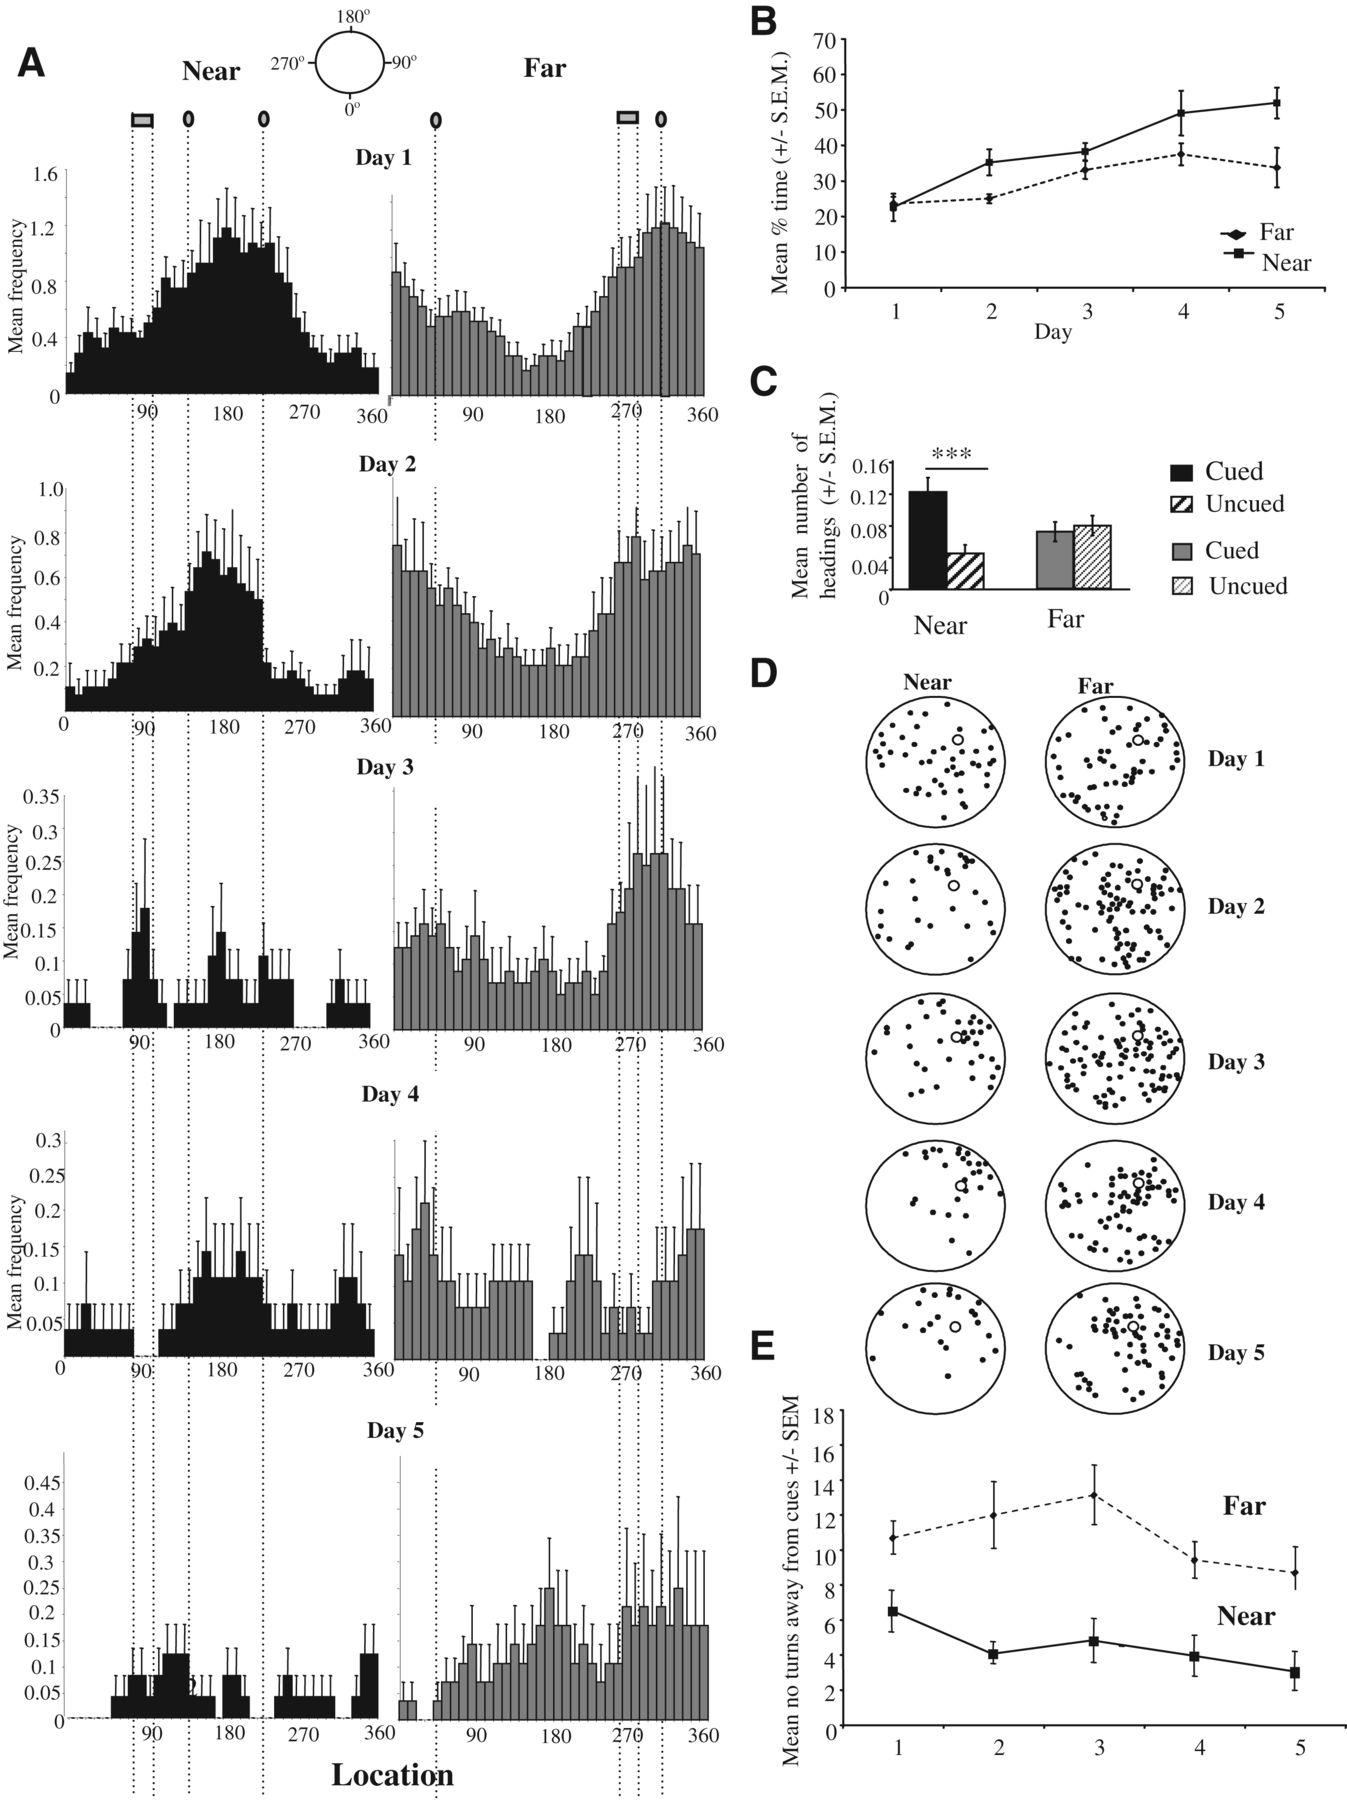
Animals show cue-dependent learning. (A) Mean frequency (±SEM) spent in vertical thigmotaxis behavior at each location (degrees) around the water maze for the Near (black) and Far (gray) groups for each day. Location of cues for both conditions is also illustrated. Note the change in scales on the graphs, reflecting that the time spent in thigmotaxis decreased with learning. (B) Mean percentage time spent along a straight path across the 5 d of training for the Near and Far groups with C highlighting the increase in direct heading toward the cued area (60°–240°) in the Near group but not the Far group (240°–60°) on Day 5. (D) Distribution of Near and Far turns away from the cues throughout training, with E illustrating the mean number of turns away from the cues for both groups on each training day.



