


Behavioral microanalyses refine sign-tracking characterization and uncover different response dynamics during omission and extinction learning
- Corresponding author: erica.s.townsend.gr{at}dartmouth.edu
Abstract
Sign-tracking, a conditioned response in which animals engage with reward-predictive cues, is a powerful behavioral tool for assessing Pavlovian motivation. In rodents, it is most frequently studied via automatic readouts, such as deflections of levers that act as reward cues. These readouts have been immensely helpful, but they may not be ideal for some tasks and paradigms. For example, animals can show a range of sign-tracking responses to a lever cue that do not result in lever deflection, and a reduction in deflections when animals are exposed to an omission contingency (i.e., when lever deflection cancels reward) hides the fact that the animals are still sign-tracking in other ways. Here, we analyzed the behavior of sign-tracking animals through both video monitoring and automatic task readouts in Pavlovian conditioning. This analysis aided in the classification of sign-tracking animals and revealed that lever deflections do not result from any identifiable pattern of sign-tracking. We then used omission and extinction procedures to unmask detailed behavior changes that can only be detected with video data. Automated readouts showed similar reductions of lever deflection in both task conditions. However, detailed behavioral analysis revealed quite distinct behavioral adaptations to these conditions with sign-tracking decreasing entirely during extinction while many sign-tracking behaviors (biting, sniffing, etc.) seemed to remain persistent during omission despite the decrease in deflections. Detailed behavioral analysis was thus critical for capturing sign-tracking maintenance, persistence, and loss.
Cues, or conditioned stimuli (CS), that predict rewards can elicit a conditioned response (CR) once the association is learned (Pavlov 1927). CR expression can vary across individuals such as in goal- and sign-tracking forms of behavior. Goal-tracking animals approach the site of reward delivery upon CS presentation (Boakes 1977). Sign-tracking animals will instead approach and sometimes physically engage with the cues themselves due to the attribution of incentive salience, resulting in a motivational urge to pursue the cues (Brown and Jenkins 1968; Berridge 2004; Flagel et al. 2009; Flagel and Robinson 2017). Strong cue attraction can predict an animal's propensity to develop addictive drug seeking (Saunders and Robinson 2013; Tunstall and Kearns 2015). Moreover, sign-tracking responses themselves can be strikingly persistent. For example, they can continue to occur when doing so carries consequences like reward loss (Breland and Breland 1961; Locurto et al. 1976; Davey et al. 1981; Chang and Smith 2016; Townsend et al. 2023), and they can resist blocking by a preconditioned cue (María-Ríos et al. 2023).
While sign-tracking and goal-tracking CRs are thought to reflect an underlying spectrum of individual differences that involve different learning processes, considerable variability even within each of these Pavlovian CR phenotypes has been documented. For example, the expression of sign-tracking can vary based on the sensory modality and experience of the cue (e.g., lever cues vs. auditory cues) (Holland 1977; Davey and Cleland 1982; Meyer et al. 2014; Singer et al. 2016; Ahrens et al. 2018), in addition to the modality of the reward that those cues predict (e.g., licking cues when rewards are liquids vs. biting when rewards are solid foods) (Jenkins and Moore 1973; Davey and Cleland 1982). Further, the behavioral topography and unique “fingerprint” of the sign-tracking response (i.e., how a given animal sign-tracks; its choreography) exhibit significant variability across individual animals (Davey et al. 1981; Davey and Cleland 1982; Eldridge and Pear 1987; DiFeliceantonio and Berridge 2012; Townsend et al. 2023).
The typical method for classifying animals as sign- or goal-trackers, in our work and in others, relies on automated readouts of lever-cue pressing and food cup entries (Meyer et al. 2012). However, importantly, animals do not need to physically interact with the cue for the response to be considered sign-tracking (Hearst and Jenkins 1974). Animals can develop distinct individual sign-tracking choreographies to the same cue type. Some sign-tracking responses are quite vigorous and consummatory (e.g., biting and grabbing lever cues), while others will favor different responses that do not involve physically touching cues, such as sniffing and orienting responses (Jenkins and Moore 1973; Buzsáki 1982; DiFeliceantonio and Berridge 2012; Chang and Smith 2016; Iglesias et al. 2023; Townsend et al. 2023). Some of these less tactile sign-tracking behaviors, consequently, may result in no lever deflections. Thus, exclusively using automatic readouts of lever pressing as the sole measure of sign-tracking may not capture the substantial variability in actual behaviors that are documented within this CR. Lever pressing as a primary measure has been immensely useful for high-throughput sign-tracking characterization, but there are conditions where it may be insufficient. Including detailed behavioral analyses may result in more accuracy when observing sign-tracking CRs, especially when studying the brain mechanisms underlying the behavior.
Although a detailed analysis of any behavior is always regarded as superior to automated task readouts, the reliance on lever deflections in the case of sign-tracking can lead to incorrect conclusions about how task changes affect sign-tracking. For example, lever CS deflections decrease during omission procedures, in which lever CS deflection cancels reward delivery for that trial (also known as negative automaintenance) (Schwartz and Williams 1972; Stiers and Silberberg 1974; Woodard et al. 1974; Locurto et al. 1976; Chang and Smith 2016). CS deflections are also reduced during extinction task conditions (Fitzpatrick et al. 2019). While the omission and extinction procedures produce nearly indistinguishable changes to lever deflections, these are very different conditions to the animal with respect to how it motivationally regards the cue. Thus, we sought to show how detailed behavioral analyses can be used to best identity sign-tracking during acquisition. Then, to showcase the disconnect between true detailed behavior and automatic measures, we further reveal how detailed analyses can distinguish the detailed response structures developed as a result of omission and extinction task environments despite their near-identical lever-pressing decay.
Results
Sign-tracking is not well characterized by CS lever presses alone
An attraction to reward-predictive CSs does not always result in vigorous, physical CS engagement. Thus, we first investigated the relationship between standard sign-tracking measures of lever pressing and individual behaviors gathered from video monitoring data. After 12 Pavlovian conditioning sessions, many animals acquired the sign-tracking response, which is displayed by an increase in lever presses per minute (ppm) (Fig. 1A). Lever presses increased significantly over sessions. Subjects also differentiated between lever types, with significantly lower press rates on the CS− lever than the CS+ lever (Fig. 1A; linear mixed effects [LME] model; effect of session: est: 2.98; confidence interval [CI]: 2.17– 3.78; P < 0.001; effect of lever: est: −21.13; CI: −28.73 to −13.52; P < 0.001; interaction between session and lever: est: −3.82; CI: −4.85 to −2.79; P < 0.001). Over Pavlovian conditioning sessions, food cup entries during CS+ lever presentations significantly decreased (Fig 1B; LME model; effect of session: est: −1.53; CI: −2.40 to −0.67; P = 0.0011). We then calculated the Pavlovian conditioned approach (PCA) (Meyer et al. 2012) index of each animal (Fig. 1C) based on the number, latency, and probability of lever deflections and food cup entries during the 12th and final session of Pavlovian conditioning. Many of the animals in this experiment were categorized as sign-tracking, however, there was still a high concentration of identified intermediates.
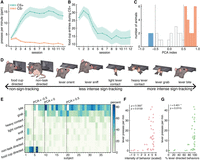
Detailed behavioral analyses are a more suitable means to study sign-tracking responses. (A) Lever ppm on the CS+ (teal) and CS− (orange) levers throughout Pavlovian conditioning. Error ribbons display ± SEM. (B) Average food cup entries during CS+ presentations throughout Pavlovian conditioning. Error ribbons display ± SEM. (C) Histogram of calculated PCA indexes during session 12. Standard PCA index cutoffs for goal-tracking and sign-tracking are displayed by dotted lines at −0.5 and 0.5, respectively. (D) Illustrations of behaviors that were scored in session 12. Behaviors range from non-sign-tracking to increased sign-tracking intensity from left to right. (E) Heatmap depicting the detailed behavioral fingerprints of all animals in session 12. Darker blue regions indicate higher engagement with those behaviors, and lighter green to white represents the least engagement with those behaviors. Subjects are arranged in order of their calculated PCA index, from −1 to 1. PCA indexes of −0.5, 0, and 0.5 are marked by dotted black lines. (F) Scatterplot of behavioral intensity (behaviors in D scaled from −1 to 6, −1 representing food cup directed, and 6 representing lever bite) and CS+ lever ppm in session 12. (G) Scatterplot of the percentage of lever-directed behaviors scored (behaviors from lever orient through lever bite in D vs. food cup–directed and non-task-directed behaviors) and lever ppm in session 12. For all plots, asterisks (*) represent statistical significance (P < 0.05).
We next sought to dig deeper into the detailed behaviors to characterize the structure and variability of the responses. Several individual behaviors were observed (Fig. 1D) from video recordings of the animals during their final Pavlovian conditioning session. These behaviors ranged from more “goal-tracking”-like or non-task directed (e.g., grooming), to quite vigorous, more consummatory sign-tracking, such as repeated biting of the lever. We mapped the behavioral “fingerprints” (i.e., charting the topography of the individual behaviors measured through video-guided analysis of each animal) of the CRs from the final session, then aligned them with their calculated PCA index (Fig. 1E). Notably, most of the animals that were identified as intermediates using the PCA index (PCA index of −0.5 to 0.5) appeared to engage primarily in sign-tracking behaviors, including quite intense behaviors such as biting and grabbing, in addition to some that do not involve physically touching the lever (e.g., sniffing). Most PCA-classified intermediates did not engage in many food-cup directed behaviors, which led us to believe that many of these animals were miscategorized, and instead were truly sign-trackers.
To explore this discrepancy between video-captured behavior and the PCA index further, we examined the relationship between an animal's physical and consummatory “intensity” of behavior. Intensity was given a scale in which goal-tracking behavior was assigned to −1, and sign-tracking behaviors ranged from 1 to 6 with the most physical and consummatory behaviors assigned as 6 (Fig. 1F). While the intensity score and lever presses were significantly correlated (Spearman rank-order correlation: ρ = 0.383; P = 0.0159), this effect may be driven by animals who goal-track that do not press the lever and engage only with the food cup. Meanwhile, many animals who engage in highly appetitive and more vigorous sign-tracking behaviors had a vast range of lever press rates ranging from 0 to >40 ppm. This could potentially be due to smaller variabilities in force or vigor within each individual behavior, in which some animals will engage in more intense behaviors but are still not forceful enough to cause lever deflection.
Finally, to confirm that the “intermediate” animals were truly sign-trackers, we assessed the proportion of behaviors scored that were lever directed versus non-task directed or food cup directed (Fig. 1G). A similar pattern was discovered, in which higher proportions of lever-directed behaviors were positively correlated with higher lever press rates (Pearson correlation: r = 0.401; P = 0.0115). A large range of press rates was once again found across animals, and even in cases when an animal's recorded behaviors were almost entirely lever-directed. This result could occur for a couple of reasons. One is that the animal's response was lever-directed, but its lever interaction was not vigorous enough to cause deflections. For example, one animal in the data set had extremely low press rates in addition to zero food cup entries during the cue. This animal could be mistaken as one that has failed to develop a CR. However, video data revealed that the animal was sniffing, orienting to, and lightly contacting the lever, which is instead indicative of a sign-tracking CR. This instance contrasts with another example animal that pressed at a much higher rate but engaged almost entirely in biting and grabbing. In this case, the detailed behaviors were aligned with automated measures. Interestingly, many animals who were categorized as “intermediates” through the PCA index also engaged in behaviors that were still just as vigorous (i.e., biting and grabbing) as animals who were considered as sign-trackers with a PCA index of at least 0.5. This observation could further imply that animals could engage in very intense behaviors, yet still not deflect the lever as much as others who have similar sign-tracking topographies. Therefore, lever deflections alone cannot reveal whether an animal is or is not engaging in sign-tracking responses. We recommend, rather than categorizing animals by purely their lever-cue deflection rates and latencies (and magazine/food cup entries), that animals instead could be categorized as sign-trackers if their behaviors are cue-directed at least 75% of the time. This approach is comparable to the PCA index cutoff of +0.5 to be considered a sign-tracker, but would lead to more accuracy in behavioral categorization. True categorization of Pavlovian CRs can only be gleaned from video analyses (which could include detailed behavior analyses, or perhaps more simply, animal position and orientation tracking).
Individual behaviors cannot explain lever deflections
We next set out to assess whether any particular behaviors resulted in more or fewer lever deflections (Fig. 2A). We only observed that animals who engaged in more grabbing behaviors had significantly more lever deflections (Pearson correlation: r = 0.416; P = 0.00837), and that more magazine directed behaviors resulted in significantly fewer lever deflections (Pearson correlation: r = −0.399; P = 0.0118). Biting (Pearson correlation: r = 0.180; P = 0.276), heavy contacting (Pearson correlation: r = 0.0961; P = 0.560), light contacting (Pearson correlation: r = 0.211; P = 0.197), orienting (Pearson correlation: r = −0.0962; P = 0.560), sniffing (Pearson correlation: r = −0.297; P = 0.0677), and non-task-directed behaviors (Pearson correlation: r = −0.236; P = 0.148) did not significantly correlate with lever deflections. We collapsed these behaviors to reduce noise and ran similar linear regressions with lever presses per minute. Biting, grabbing, and heavy contacting were collapsed into “high” vigor behaviors, while light contacting, sniffing, and orienting were compiled into “low” vigor behaviors (Fig. 2B). High-vigor behaviors were correlated with lever pressing (Pearson correlation: r = 0.389; P = 0.0142). No correlation was found between lower vigor behaviors and lever pressing (Pearson correlation: r = −0.0602; P = 0.715).
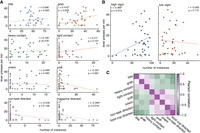
Individual behaviors cannot reliably predict lever pressing. (A) Scatterplots of individual behaviors (left to right, top to bottom: lever bite, lever grab, heavy contact, light contact, lever orient, lever sniff, non-task directed, food-cup directed) and lever presses per minute during session 12 of Pavlovian conditioning. Linear models are depicted in each plot. (B) Scatterplots of collapsed high (bite, grab, heavy contact; top) and low (light contact, orient, sniff; bottom) vigor lever-directed behaviors and lever presses per minute during session 12 of Pavlovian conditioning. Linear models are depicted in each plot. For all plots, asterisks indicate significant results. (C) Pearson correlation matrix of each individual behavior. Dark purple indicates R-values closer to 1, and dark green indicates R-values closer to −1. For all plots, asterisks (*) represent statistical significance (P < 0.05).
As noted, animals may have specific choreographies of individual behaviors that are strung together when they are sign-tracking. Choreographies vary and are not identical between all sign-tracking animals (see Fig. 1E). For example, some animals engage in more approach, rather than consummatory, behavior (e.g., sniffing, rather than biting). In line with a phenotype of less vigorous, “approach”-style sign-tracking responding, we found that the less vigorous behaviors such as lighter contacts, sniffing, and orienting, tended to be strongly correlated with each other (Fig. 2C). The most intense or consummatory behaviors (biting, grabbing, and heavy contacting) were weakly correlated with each other, but were negatively associated with all other behaviors. This may indicate a separate phenotype of “intense” or “consummatory” sign-tracking. We further uncovered potential intermediate behavioral choreographies, as food cup directed behaviors were strongly correlated with both lever sniffing and orienting.
Overall, even detailed behavior analyses could not fully explain if an animal will press lever CSs more or less. In other words, while lever deflections are generally correlated with sign-tracking responding, they are not easily predicted by any particular type of sign-tracking behavior. Even some very intense behaviors such as biting and grabbing the lever cue will not reliably result in deflection all the time (Fig. 2A; see also Fig. 1E). Thus, it is difficult to know if animals are engaging with the lever CS or not based on lever deflection alone, which can sometimes render it as an unreliable measure. Instead, as stated, incorporating a more detailed array of behavioral factors (or, possibly, the number of cue-directed behaviors or amount of time spent attending to cues) could lead to more accurate representations of animal behavior as regards sign-tracking. Detailed mapping of behaviors is also more favorable when discussing whether an animal is “more” or “less” intensely sign-tracking, as pressing alone sometimes can miss less intense behaviors and, in some examples, miss even the most vigorous sign-trackers.
Behavioral details provide insight into underlying, dynamic sign-tracking structures
Omission (known also as negative automaintenance) (Stiers and Silberberg 1974; Locurto et al. 1976), in which lever deflections result in the cancellation of reward delivery on that trial (Fig. 3A), is a striking example of how cues retain motivational value even when engagement can be detrimental. It is also a situation in which inaccurate conclusions will result when only lever-cue pressing is considered as the primary measure of sign-tracking. Behavioral details are important to studying sign-tracking animals in this omission task, as they reveal that animals do not cease responding, but rather alter the structure of responding to meet the new contingency while continuing to sign-track (Davey et al. 1981; Eldridge and Pear 1987; Chang and Smith 2016; Townsend et al. 2023). When only automatic readouts of lever deflection are observed in this task, an incorrect conclusion would be reached that sign-tracking decreases because lever pressing diminishes. Thus, here we use an omission task to (1) replicate prior findings, (2) further evaluate behavioral sign-tracking details, and (3) provide a foundation of comparison with extinction conditions as below.
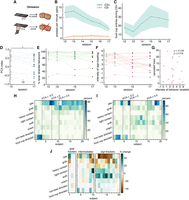
Detailed behavior analysis is integral to accurately capturing behavioral changes in omission. (A) Visualization of omission task. (B) Lever presses per minute (ppm) on the CS+ (teal) and CS− (orange) levers from the final Pavlovian conditioning session (12) through omission (13–17). Error ribbons display ± SEM. (C) Average food cup entries during CS+ presentations from the final Pavlovian conditioning session (12) through omission (13–17). Error ribbons display ± SEM. (D) Line plot of the PCA index change for each individual subject starting in the final Pavlovian conditioning session (session 12) through the final omission session (17). (E) Line plots of each individual animal's percentage of lever directed behaviors (behaviors from lever orient through lever bite in Fig. 1D vs. food cup directed and non-task directed behaviors) starting from the final Pavlovian conditioning session (session 12) through omission (sessions 13–17). (F) Line plots of each individual animal's sign-tracking intensity (behaviors in Fig. 1D scaled from −1 to 6, −1 representing food cup directed, and 6 representing lever bite) starting from the final Pavlovian conditioning session (session 12) through omission (sessions 13–17). (G) Scatterplot of the intensity of sign-tracking behavior and the amount of cancelled (deflected) trials. (H) Heatmap depicting the detailed behavioral fingerprints of animals in the final Pavlovian conditioning session (12). Darker blue regions indicate higher engagement with those behaviors, and lighter green to white represents the least engagement with those behaviors. Subjects are arranged in order of their calculated PCA index, from −1 to 1. PCA indexes of −0.5, 0, and 0.5 are marked by dotted black lines. (I) Heatmap depicting the detailed behavioral fingerprints of all animals in the final omission session (17). Darker blue regions indicate higher engagement with those behaviors, and lighter green to white represents the least engagement with those behaviors. Subjects are arranged in order of their calculated PCA index during this session (session 17), from −1 to 1. PCA indexes of −0.5, 0, and 0.5 are marked by dotted black lines. (J) Heatmap depicting the percent change in individual behaviors of all animals from session 12 to session 17. Orange indicates negative percent change, and blue represents positive percent change. Subjects are grouped by their initial, session 12 PCA-derived categorization (<−0.5: left; >−0.5 and <0.5: middle; >0.5: right), and ordered from −1 to 1 from left to right, as in H. For all plots, asterisks (*) represent statistical significance (P < 0.05).
As expected, animals decreased their lever deflection rate as they learned the omission rules over five sessions (Fig 3B; LME model; effect of session: est: −7.16; CI: −9.95 to −4.38; P < 0.001; effect of lever: est: −143.93; CI: −196.30 to −91.56; P < 0.001; interaction between session and lever: est: 7.50; CI: 3.91–11.08; P < 0.001). Food cup entries moderately increased over sessions (Fig. 3C; LME model; effect of session: est: 2.78; CI: 0.55–5.01; P = 0.015), in line with previous reports of a food cup “checking” behavior that develops in some sign-trackers during this omission task (Townsend et al. 2023). The PCA indexes tended to decrease after animals completed omission (Fig. 3D) (t = 3.67; P = 0.002), reflecting the reduction in lever pressing and increasing food cup entries. However, there was a highly variable range of PCA scores that erroneously indicated that many of these animals were not sign-tracking, during the final session (session 12) of Pavlovian conditioning as well as after the completion of the task (session 17) (Fig. 3D). Upon closer look at the proportion of behaviors scored, most of these animals remained at the lever at least 80% of the time, even as omission experience progressed over days (Fig. 3E). This reveals that animals were indeed continuing to sign-track throughout omission learning, despite the significant drop in lever press rates and the ranging PCA indexes. Detailed behavior analyses can explain this decrease. Subjects did not cease sign-tracking, but instead tended to decrease the intensity of their sign-tracking responses to incorporate less vigorous behaviors, such as sniffing, that do not lead as often to lever deflection (Fig. 3F).
The behavioral intensity of sign-tracking responses did not correlate with how many cancelled trials (i.e., a trial in which the lever was pressed) an animal would accumulate over a session (Spearman rank-order correlation: ρ = −0.086; P = 0.718) (Fig. 3G). This was expected given that sign-tracking behaviors before omission were found to be unreliable predictors of lever pressing (Fig. 2). This finding of a similar lack of correlation during omission underscores the conclusion that animals can robustly sign-track without causing lever deflection.
We further charted the topography of the individual behaviors measured through video-guided analysis of each animal, creating fingerprints of the CRs that we aligned with their calculated PCA index on their final Pavlovian conditioning session (session 12) (Fig. 3H) and the final omission session (session 17) (Fig. 3I). The individual behaviors observed between these two sessions were markedly different. A strong bias toward more intense behaviors, such as biting and grabbing, was seen before omission in session 12 (Fig. 3H). However, once animals learned the omission contingency, animals tended to avoid touching the lever while still maintaining their attraction to it. Less intense behaviors such as orienting, sniffing, and light lever contacts thus became more prominent (session 17) (Fig. 3I). Of note, a larger range of animals were classified as intermediates rather than sign-trackers based on the PCA index during omission (Fig. 3D,I,J) compared to the last acquisition session (Fig. 3H). These animals did still overwhelmingly display lever-directed behaviors (Fig. 3J).
Behavioral details can confirm the presence or absence of sign-tracking responses
Extinction, in which cues no longer predict reward delivery (Fig. 4A), can also be used to test sign- and goal-tracking response persistence when task conditions change. When sign-tracking animals undergo extinction, the presumption is that animals will decrease responding entirely, as the cue no longer holds any predictive value for reward. In a prior study, sign-trackers were found to slowly extinguish their response as a form of persistence (Fitzpatrick et al. 2019). Here, we found that lever-pressing events were readily extinguished over the five extinction sessions (Fig. 4A,B; LME model; effect of session: est: −11.02; CI: −14.09 to −7.95; P < 0.001; effect of lever: est: −190.14; CI: −240.74 to −139.54; P < 0.001; and interaction between session and lever: est: 10.84; CI: 7.38–14.30; P < 0.001). This reduction in lever presses during extinction was indistinguishable to the reduction in lever presses during omission (see Fig. 3B). A slight decline in food cup entries on the first session of extinction was also observed, which was likely driven by the few goal-tracking animals (Fig. 4C). However, there were no significant effects of session on food cup entries over all of extinction (LME model; no effect of session: est: −1.84; CI: −4.76 to 1.08; P = 0.215). As with omission, PCA indexes were variable on the final Pavlovian conditioning session (session 12) (Fig. 4D). However, the PCA indices of animals after completion of the omission task differed significantly from their initially calculated PCA index on the last acquisition day (t = −2.73; P = 0.014) (Fig. 4D), with many animals trending closer to a PCA index of 0.
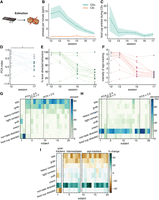
Detailed behavior analyses align with lever presses in extinction. (A) Visualization of extinction task. (B) Lever ppm on the CS+ (teal) and CS− (orange) levers from the final Pavlovian conditioning session (12) through extinction (13–17). Error ribbons display ± SEM. (C) Average food cup entries during CS+ presentations from the final Pavlovian conditioning session (12) through extinction (13–17). Error ribbons display ± SEM. (D) Line plot of the PCA index change for each individual subject starting in the final Pavlovian conditioning session (session 12) through the final extinction session (17). (E) Line plots of each individual animal's percentage of lever directed behaviors (behaviors from lever orient through lever bite in Fig. 1D vs. food cup directed and non-task directed behaviors) starting from the final Pavlovian conditioning session (session 12) through extinction (sessions 13–17). (F) Line plots of each individual animal's sign-tracking intensity (behaviors in Fig. 1D scaled from −1 to 6, −1 representing food cup directed, and 6 representing lever bite) starting from the final Pavlovian conditioning session (session 12) through extinction (sessions 13–17). (G) Heatmap depicting the detailed behavioral fingerprints of all animals in the final Pavlovian session (12). Darker blue regions indicate higher engagement with those behaviors, and lighter green to white represents the least engagement with those behaviors. Subjects are arranged in order of their calculated PCA index, from −1 to 1. PCA indexes of −0.5, 0, and 0.5 are marked by dotted black lines. (H) Heatmap depicting the detailed behavioral fingerprints of all animals in the final extinction session (17). Darker purple regions indicate higher engagement with those behaviors, and lighter pink to white represents the least engagement with those behaviors. Subjects are arranged in order of their calculated PCA index, from −1 to 1. PCA indexes of −0.5, 0, and 0.5 are marked by dotted black lines. (I) Heatmap depicting the percent change in individual behaviors of all animals from session 12 to session 17. Orange indicates a negative percent change, and blue represents a positive percent change. Subjects are grouped by their initial, session 12 PCA-derived categorization (<−0.5: left; >−0.5 and <0.5: middle; >0.5: right), and ordered from −1 to 1 from left to right, as in G. For all plots, asterisks (*) represent statistical significance (P < 0.05).
Due to the similarities in lever pressing and PCA index dynamics to omission, we decided to then investigate behavioral details to further confirm that animals did indeed extinguish responding rather than continuing to be cue-directed without deflections as seen in omission. The proportion of lever-directed behaviors scored from video monitoring declined in most animals during extinction, suggesting that the animals did indeed extinguish their sign-tracking responses (Fig. 4E). In line with this result, the intensity of sign-tracking diminished in nearly all animals, ultimately hovering around the low score of 0-to-1 (i.e., these are non-lever directed and lever orienting behaviors) (Fig. 4F).
Behavioral fingerprints, or a mapping of the topography of the individual behaviors measured through video-guided analysis of each animal, were assessed on the final Pavlovian conditioning session (Fig. 4G) and the final extinction sessions (Fig. 4H). These analyses showed that animals do not alter their structure of sign-tracking as they do in omission (Fig. 3H), but instead, they cease lever-directed behaviors entirely (Fig. 3I). By the final extinction session (17), animals were almost entirely engaging in non-task directed behaviors during cue presentations (Fig. 4H,I). Peculiarly, the PCA index still identified some animals as sign-trackers despite the fact that they did not engage in cue-directed behaviors much, if at all. This could occur, for example, when the animal deflects the lever only once or twice during the whole session and never enters the magazine, leading to a skewed and thus misleading PCA calculation. In short, the decrease in lever pressing in extinction did accurately reflect the reduction of sign-tracking, while the similarly reduced pressing in omission did not capture the underlying persistence in sign-tracking.
Discussion
Sign- and goal-tracking are robust and well-documented CRs to Pavlovian cues (Hearst and Jenkins 1974; Flagel et al. 2009). These two CRs have been used as predictors of vulnerable populations in maladaptive reward seeking, as animals who attribute incentive salience to cues and exhibit sign-tracking behaviors are more likely to engage in addiction-like behaviors and drug seeking (Saunders and Robinson 2011, 2013; Tunstall and Kearns 2015; Pitchers et al. 2017). Thus, the sign-tracking phenotype has become an important tool to study motivation and learning in both basic science and preclinical settings. However, the richness and diversity of sign-tracking behavioral details are often neglected, with us and others opting to use lever-cue presses and food cup beam breaks as primary or sole measures. These automated measures have been useful for characterizing sign-tracking in a high-throughput manner and determining the brain basis of sign-tracking along with its relationship to addiction. However, reliance on automated readouts neglects important nuances of individual animals’ sign-tracking behaviors. As shown here for omission versus extinction conditions, those nuances are critical for interpretation. Specifically, we show that standard measures such as lever pressing are quite similar in omission and extinction (compare Figs. 3B and 4B), yet animals undergoing omission learning continue to sign-track while those undergoing extinction learning do not (compare Figs. 3I and 4H). Further, animals that are quite intense and consummatory in their lever-directed responses still are sometimes miscategorized as intermediates by automated measures such as the PCA index (see Fig. 1E).
While physical engagement with a reward cue is unnecessary for a response to be considered sign-tracking (i.e., animals can approach cues without physically contacting them), lever-cue pressing is still frequently related to the strength of sign-tracking responses. In other words, animals who press more also sign-track more. The PCA index is an example of this notion: animals who press at higher rates and have lower latencies to press have higher PCA scores and are thus considered stronger sign-trackers. Our results found that this is true in some circumstances, as some animals exhibited quite vigorous behaviors such as biting and grabbing, which was reflected in their high rates of lever pressing (Fig. 1E–G). Some individuals engaged with the lever cue without physically contacting it by sniffing or orienting. Measures such as lever press rates and the PCA index were not sensitive enough to capture cue-directed behaviors that do not reliably lead to presses, and thus this resulted in some sign-tracking animals to be miscategorized as intermediates (Fig. 1E).
Curiously, there were not any behaviors that strongly predicted lever pressing (Fig. 2). While we attempted to use a wide range of potential behaviors when analyzing the microstructures of responses, there is considerable variability within each category. For example, animals could bite by forcefully shaking the lever with their teeth, or bite gently by nibbling with little force. Importantly, a large group of animals engaged with the lever cue as intensely as animals who were considered sign-trackers by the PCA index, but still managed to do so without their behavior resulting in many lever deflections (Fig. 1E–G). For identifying sign-tracking animals, we encourage an approach that could be as simple as labeling only the subjects that spent at least 75% of their behaviors directed toward the cue as sign-trackers, comparable to the PCA index in which only animals with a score in the highest 25% (index of 0.5–1) are considered sign-trackers.
While the sign-tracking expression may be mediated by learning conditions and innate individual differences as we see, distinct response patterns can also arise in animals based on the modality of the cue or reward (Jenkins and Moore 1973; Holland 1977; Meyer et al. 2014). Lever cues are typically favored for sign- and goal-tracking paradigms; however, it is known that sign-tracking responses can vary (or in some cases, cease to exist) based on different cue modalities that are not as discrete or localizable, or as easy to interact with, such as tones (Meyer et al. 2014). Further, animals tend to sign-track toward cues as if they were the reward itself (e.g., biting for food or licking for liquids). One would thus expect that different patterns of responses will arise when animals are anticipating different rewards such as food, water, drugs, or brain-stimulation-reward (Jenkins and Moore 1973; Davey and Cleland 1982).
The responses of animals to extinction and omission contingencies touches on the question of how persistent sign-tracking becomes once it is acquired. Sign-tracking can be highly sensitive to the identity (as above) and value of the reward outcome, thus exhibiting characteristics of flexible or “model-based” learning (Robinson and Berridge 2013; Dayan and Berridge 2014). Although sign-tracking has previously demonstrated resistance to reward devaluation via a taste aversion procedure in several studies, including our own (Morrison et al. 2015; Nasser et al. 2015; Smedley and Smith 2018; Keefer et al. 2020), recent studies indicate that sign-tracking is instead sensitive to such reward devaluation if it is completed in a manner that allows for translation to the task context by pairing illness within the task environment rather than in a different environment (Derman et al. 2018; Amaya et al. 2020; Bien and Smith 2023; María-Ríos et al. 2023). Neither the increase nor the decrease in sign-tracking following reward value increments or decrements are explainable by changes in the value of the task context itself, but rather reflect a change in the response-reward value (Dayan and Berridge 2014; Amaya et al. 2020; Bouton et al. 2021; Garrett et al. 2023). Less severe outcome value changes, such as satiety, may have less of an impact on sign-tracking (Kochli et al. 2020; Keefer et al. 2022).
Outside of outcome-value manipulations, sign-tracking can be seen as persistent. For example, sign-trackers are slower to extinguish their response than goal-trackers (Fitzpatrick et al. 2019), are resistant to the extinction of instrumental contingencies (Ahrens et al. 2016), and resist Pavlovian blocking (Holland et al. 2014; María-Ríos et al. 2023). We show here and elsewhere that sign-tracking also persists despite the omission contingency (Chang and Smith 2016; Townsend et al. 2023). Of note, lever deflections that become punished by reward loss never drop to zero during omission, which is also true of the extinction condition here, reflecting a high degree of reward-cue attraction that appears difficult to completely abstain from. Sign-tracking thus reflects a characteristic of Pavlovian incentive motivation in general, in which the incentive salience of a cue can in some cases become decoupled from the reward itself and persist maladaptively or “irrationally” (Berridge 2004).
Overall, our analyses reveal behavioral dynamics that exist beyond measures of “more” or “less” sign-tracking, and understanding these dynamics can be key to understanding conditions under which the incentive value of reward cues is acquired, and is maintained or lost when task features change. Perhaps focusing on the structure of behaviors could elucidate current discrepancies in Pavlovian CR literature in the future; for example, the potential for sex differences in sign-tracking (Hammerslag and Gulley 2014; Pitchers et al. 2015; Bien and Smith 2023). With recent advances in animal tracking software, these types of natural behavior analyses have become quicker, simpler, and more accessible (Mathis et al. 2018; Pereira et al. 2022; Goodwin et al. 2024), which will be of value going forward. Analyses of behavioral microstructures such as these could serve as a foundation or a ground truth for validating measures new software programs can provide. Rigorous measures of sign-tracking and other behaviors will also likely be fruitful for understanding brain mechanisms of reward-cue attractions.
Materials and Methods
Subjects
Subjects were 40 PN 70–90 male (n = 20) and female (n = 20) Long Evans rats (Envigo, Indianapolis, IN) on a 12 h light–dark cycle (lights on at 7 a.m.). Experiments were conducted during the light cycle. Rats were single-housed and food restricted (7–15 g of standard chow per day) to 85% of their free-feeding weight throughout testing. These conditions (as well as others, such as vendor and genetic strain) may increase the preponderance of sign-tracking, which was our goal as it allowed us a greater chance to study the variability of this response across individuals. Water was available ad libitum. All procedures were approved by the Dartmouth College IACUC.
Testing apparatus
Tests were conducted in identical chambers (20 × 30.5 × 29 cm; Med Associates, St. Albans, VT) enclosed in sound- and light-attenuating cabinets (62 × 56 × 56 cm) equipped with a fan for airflow and background noise (∼68 dB) and illuminated by a house light on the back wall. Chambers contained two retractable levers (which were standardized across chambers and required 25 g of force for a deflection to be recorded) on either side of a recessed magazine in which food rewards were delivered. Lever deflections and magazine entries were recorded using the MED-PC IV software. Videos were recorded for behavioral analysis.
Pavlovian conditioning
Training began with a 30 min magazine acclimation session where one pellet was delivered approximately every 30 sec. Rats then received 12 sessions of Pavlovian conditioning. These sessions contained 25 CS+ trials in which a 10 sec presentation of a retractable lever was followed by noncontingent 45 mg grain pellet (BioServ, Frenchtown, NJ) delivery, and 25 CS− trials in which the 10 sec presentation of the other retractable lever was followed by nothing. CS+ and CS− lever sides were counterbalanced across animals. Trials were pseudorandomized such that no more than two of the same trial types were followed in sequence. Intertrial intervals had a length of ∼2 min. Sessions lasted ∼1 h.
Omission
After completing 12 training sessions, one group of rats (n = 20; 10 male and 10 female) underwent five sessions of omission testing. Similar to the Pavlovian conditioning schedule, these sessions contained 25, 10 sec CS+ trials and 25, 10 sec CS− trials. Under the omission condition, a deflection of the CS+ lever at any time during the trial would cancel reward delivery for that trial. Pellets would be delivered only following CS+ trials in which the rats withheld lever deflections.
Extinction
After completing 12 training sessions, a second group of rats (n = 20; 10 male and 10 female) underwent five sessions of extinction testing. Like the Pavlovian training schedule, these sessions contained 25, 10 sec CS+ trials and 25, 10 sec CS− trials; only now the CS+ lever no longer predicted reward, thus the animals received no pellets during these sessions.
Behavior video scoring
Videos were hand-scored by a single scorer (to avoid discrepancy between multiple scorers) that was blind to the animals’ task groupings and PCA indexes. Videos were scored for four sessions: sessions 12, 13, 17, and 19. Within each session for a given animal, 10 of the 25, 10-sec CS+ trials were scored: the first trial, every third trial, and the final trial. Each second was scored for a total of 10 behaviors per trial, and 100 total scored behaviors per session. Behaviors were scored into seven predetermined categories: lever bites, lever grabs (one paw on each side of the lever), heavy lever contacts (contacts in which two paws are on the top of the lever and moderate to heavy force is put upon it), light lever contacts (contacts in which one or two paws are on either the top or bottom of the lever, grazing it gently with little to no force applied), lever sniffs (snout close to or touching the lever), lever orients (staring at the lever from any point in the chamber), non-task directed behaviors (orienting or approaching CS− lever wall, orienting away from CS+ lever, grooming, etc.), and food cup directed behaviors (any “goal-tracking”-like behavior, including food cup approach, food cup orienting, magazine entry, chewing the food cup, etc.).
Automatic measures and analysis
The timing and number of lever deflections, magazine entries, and amount of time spent in the magazine area were recorded through Med-PC (Med Associates, St Albans, VT). PCA score calculation was adapted directly from Meyer et al. (2012), and was an average of response bias (difference between lever presses and food cup entries, divided by the sum of the two), probability difference (difference between the probability of a lever press and the probability of a food cup entry), and latency score (difference between the mean latency to press the lever or mean latency to enter the food cup, divided by the cue time, which in this case was 10 sec). Med-PC outputs were processed using custom Python scripts (publicly available at https://github.com/ericastownsend/medpc_wrangler). All statistical tests and linear regressions were completed in Python 3 (packages: scipy-stats; scikit-learn) with the exception of LME models, which were run in R (packages: lme4; lmerTest). For all LME models, parameter estimates (est: β values), 95% CI, and P-values are reported for the predictors. LMEs were chosen as they consider aspects of the data structure that repeated measures ANOVA cannot and allow for safer generalization to larger populations. Pearson correlations (r) were made for all continuous variable comparisons, while Spearman rank-order correlations (ρ) were made when a variable was categorical. The alpha for all statistical tests was 0.05. All plots were created in Python (packages: matplotlib; seaborn) and designed in Adobe Illustrator.
Acknowledgments
We thank Daniela Garrod for assistance with data collection, and Angela Shang for her artistic and illustrative contributions in addition to assistance with data collection. We also thank Drs. Katherine Nautiyal, Matthjis van der Meer, Talia Lerner, Elizabeth Smedley, and Marvin Maechler for their thoughtful comments and analysis consulting. This research was supported by a National Institute of Drug Addiction grant R01DA044199 to K.S.S.
Author contributions: E.S.T. designed the studies, collected and analyzed the data, and wrote the manuscript. K.S.S. provided funds and supervision, was involved in the overall design of the projects, and the writing of the manuscript.
Footnotes
-
Article is online at http://www.learnmem.org/cgi/doi/10.1101/lm.054065.124.
- Received August 21, 2024.
- Accepted January 27, 2025.
This article is distributed exclusively by Cold Spring Harbor Laboratory Press for the first 12 months after the full-issue publication date (see http://learnmem.cshlp.org/site/misc/terms.xhtml). After 12 months, it is available under a Creative Commons License (Attribution-NonCommercial 4.0 International), as described at http://creativecommons.org/licenses/by-nc/4.0/.



