


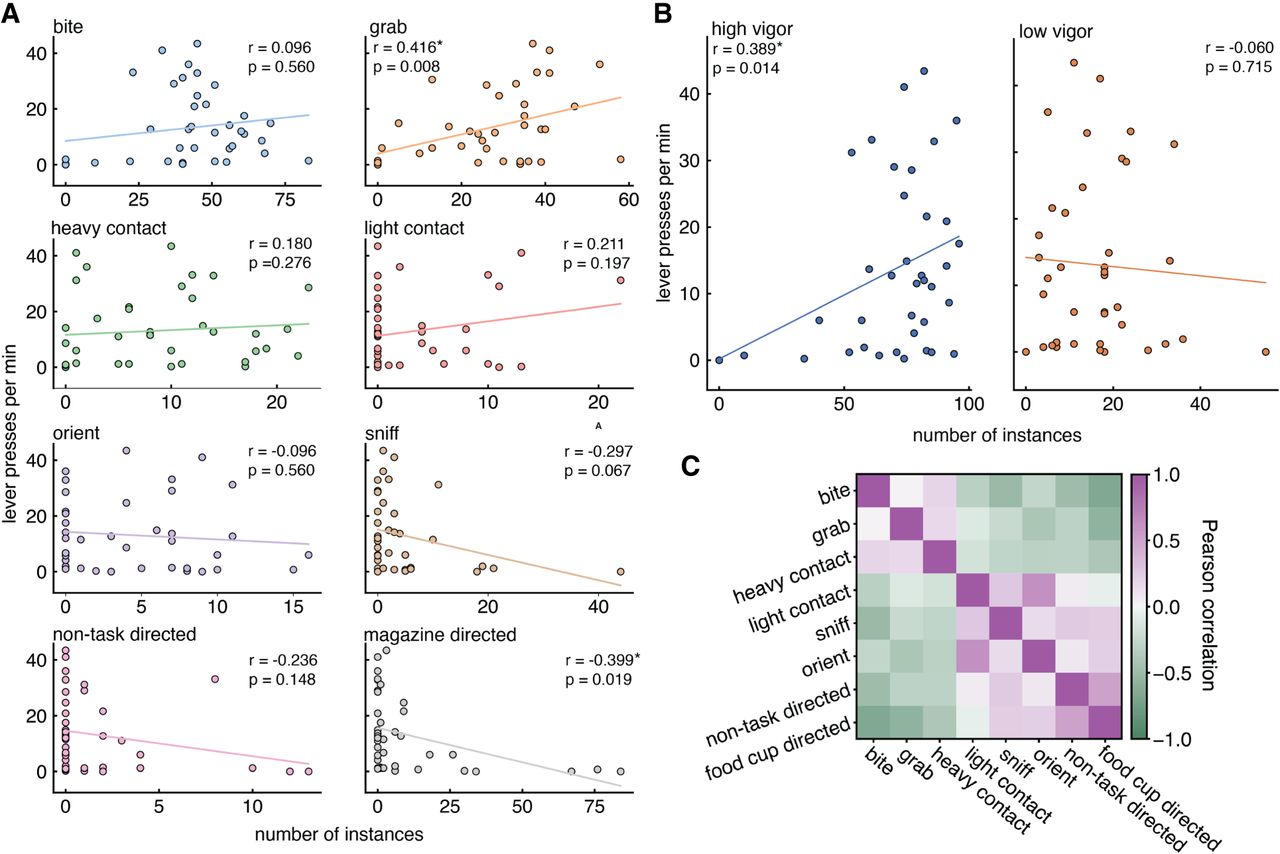
Individual behaviors cannot reliably predict lever pressing. (A) Scatterplots of individual behaviors (left to right, top to bottom: lever bite, lever grab, heavy contact, light contact, lever orient, lever sniff, non-task directed, food-cup directed) and lever presses per minute during session 12 of Pavlovian conditioning. Linear models are depicted in each plot. (B) Scatterplots of collapsed high (bite, grab, heavy contact; top) and low (light contact, orient, sniff; bottom) vigor lever-directed behaviors and lever presses per minute during session 12 of Pavlovian conditioning. Linear models are depicted in each plot. For all plots, asterisks indicate significant results. (C) Pearson correlation matrix of each individual behavior. Dark purple indicates R-values closer to 1, and dark green indicates R-values closer to −1. For all plots, asterisks (*) represent statistical significance (P < 0.05).



