


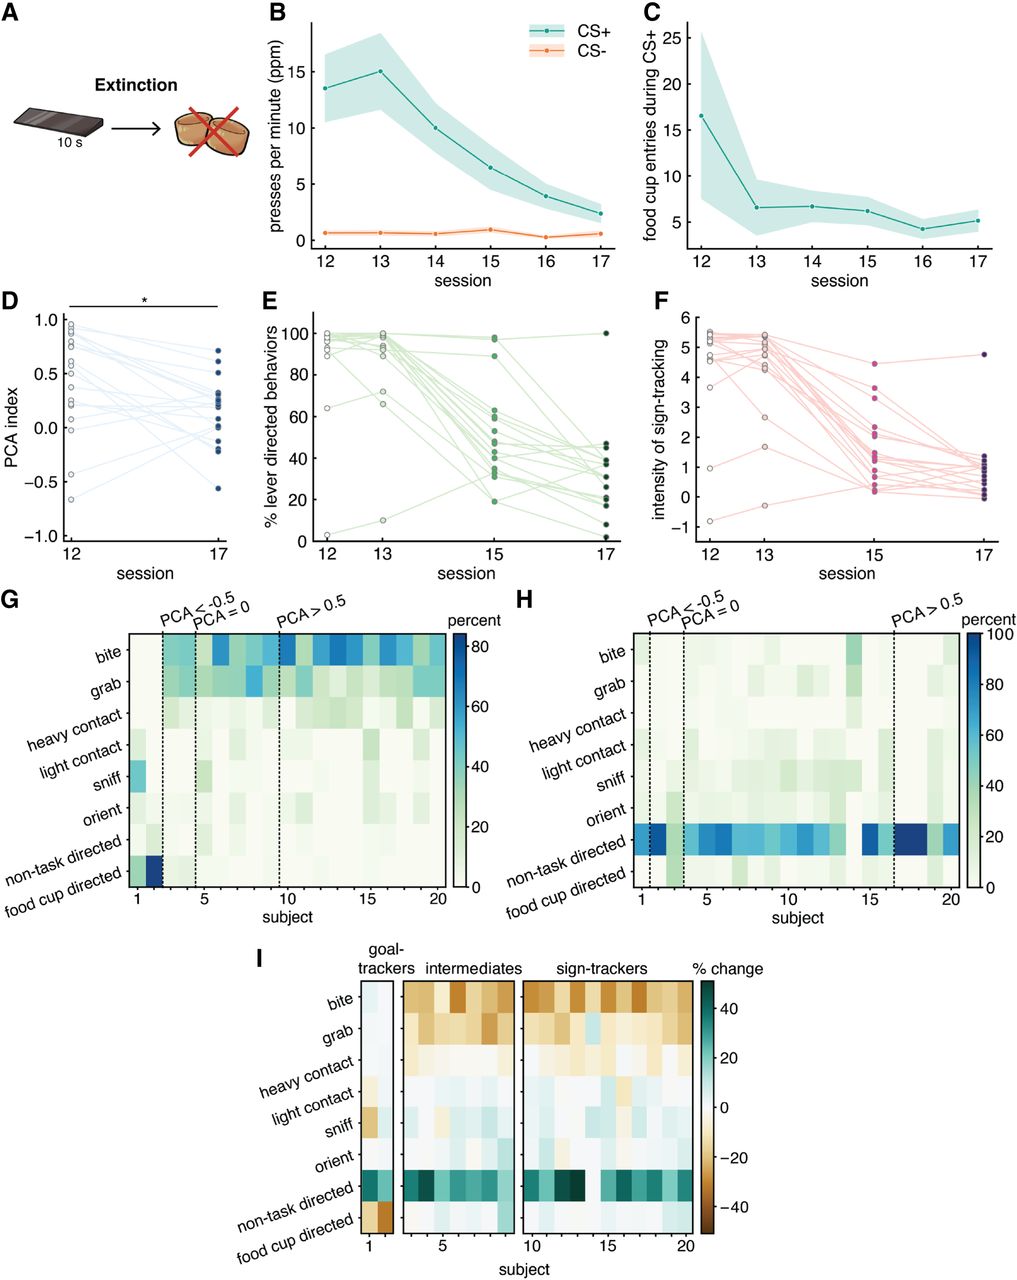
Detailed behavior analyses align with lever presses in extinction. (A) Visualization of extinction task. (B) Lever ppm on the CS+ (teal) and CS− (orange) levers from the final Pavlovian conditioning session (12) through extinction (13–17). Error ribbons display ± SEM. (C) Average food cup entries during CS+ presentations from the final Pavlovian conditioning session (12) through extinction (13–17). Error ribbons display ± SEM. (D) Line plot of the PCA index change for each individual subject starting in the final Pavlovian conditioning session (session 12) through the final extinction session (17). (E) Line plots of each individual animal's percentage of lever directed behaviors (behaviors from lever orient through lever bite in Fig. 1D vs. food cup directed and non-task directed behaviors) starting from the final Pavlovian conditioning session (session 12) through extinction (sessions 13–17). (F) Line plots of each individual animal's sign-tracking intensity (behaviors in Fig. 1D scaled from −1 to 6, −1 representing food cup directed, and 6 representing lever bite) starting from the final Pavlovian conditioning session (session 12) through extinction (sessions 13–17). (G) Heatmap depicting the detailed behavioral fingerprints of all animals in the final Pavlovian session (12). Darker blue regions indicate higher engagement with those behaviors, and lighter green to white represents the least engagement with those behaviors. Subjects are arranged in order of their calculated PCA index, from −1 to 1. PCA indexes of −0.5, 0, and 0.5 are marked by dotted black lines. (H) Heatmap depicting the detailed behavioral fingerprints of all animals in the final extinction session (17). Darker purple regions indicate higher engagement with those behaviors, and lighter pink to white represents the least engagement with those behaviors. Subjects are arranged in order of their calculated PCA index, from −1 to 1. PCA indexes of −0.5, 0, and 0.5 are marked by dotted black lines. (I) Heatmap depicting the percent change in individual behaviors of all animals from session 12 to session 17. Orange indicates a negative percent change, and blue represents a positive percent change. Subjects are grouped by their initial, session 12 PCA-derived categorization (<−0.5: left; >−0.5 and <0.5: middle; >0.5: right), and ordered from −1 to 1 from left to right, as in G. For all plots, asterisks (*) represent statistical significance (P < 0.05).



