


Network motifs exhibiting a differential response to spaced and massed inputs
- 1Chemical Engineering and Process Development Division, CSIR-National Chemical Laboratory, Pune 411008, India
- 2Academy of Scientific and Innovative Research (AcSIR), Ghaziabad 201002, India
- 3CSIR-Institute of Genomics and Integrative Biology, New Delhi 110025, India
- Corresponding author: cj.gadgil{at}ncl.res.in
Abstract
One characteristic of long-term memory is the existence of an inverted U-shaped response to increasing intervals between training sessions, and consequently, an optimal spacing that maximizes memory formation. Current models of this spacing effect focus on specific molecular components and their interactions. Here, we computationally study the underlying network architecture, in particular, the potential of motif dynamics in qualitatively capturing the spacing effect in a manner that is independent of the animal model, biomolecular components, and the timescales involved. We define a common training and test protocol, and computationally identify network topologies that can qualitatively replicate the experimentally observed characteristics of the spacing effect. For 41 motifs derived from fundamental network architectures such as autoregulation, feedback, and feedforward motifs, we tested their capacity to manifest the spacing effect in terms of an inverted U-shaped response curve, using different combinations of stimulation protocols, response metrics, and kinetic parameters. Our findings indicate that positive feedback motifs where the stimulus enhances conversion reaction in the loop replicate the spacing effect across all response metrics, while feedforward motifs exhibit a metric-specific spacing effect. For some parameter combinations, linear cascades of activation and conversion reactions were found sufficient to qualitatively exhibit spacing effect characteristics.
Long-term memory (LTM) formation is known to be influenced by the temporal distribution of the training sessions, as first identified by Ebbinghaus (1913). This phenomenon, termed the spacing effect, refers to the observation that LTM is enhanced when training stimuli are presented at distributed intervals over time rather than as a single combined signal. For this reason, the interval between consecutive stimuli has long been identified as a crucial factor determining the likelihood of memory consolidation. Since its identification in humans, this cognitive phenomenon has been observed in various animal models, ranging from invertebrates to primates (Kornmeier and Sosic-Vasic 2012; Philips et al. 2013a; Smolen et al. 2016). Whether examined in humans, or in experiments involving animal or cellular models, the spacing effect consistently demonstrates that distributing learning sessions over time (spaced learning), as opposed to a single combined session (massed learning), leads to enhanced memory retention and retrieval. In addition, several studies also report the existence of optimal spacing of the learning sessions beyond which the advantage due to spacing is no longer observed (Kornmeier et al. 2014; Carpenter 2017; Smith and Scarf 2017). This optimal spacing can range from milliseconds in some cases (Kumpulainen et al. 2012) to weeks in others (Sobel et al. 2011), in all cases resulting in an inverted U-shaped response to increasing intervals between training sessions. This phenomenon has been experimentally observed across different species, timescales, and diverse learning contexts, suggesting that it has a fundamental role in memory processes. Hence, understanding the spacing effect is likely to be a key step in comprehending the mechanisms of memory consolidation and learning.
Experimental studies have identified several signal transduction pathways contributing to the observed spacing effect, and identified diverse biomolecules, including kinases, phosphatases, and transcription factors, as key modulators of the effect (Naqib et al. 2012; Philips et al. 2013a; Smolen et al. 2016). Several mathematical and conceptual models have been developed to investigate the role of these biomolecules in the context of specific experimental systems (Supplemental Table S1). These models effectively simulate the spacing effect by modeling the interactions within specific sets of biomolecules, signaling pathways, and training protocols (Farah et al. 2009, 2015; Kim et al. 2010; Naqib et al. 2011; Zhang et al. 2012; Liu et al. 2013; Philips et al. 2013b). However, to our knowledge, the broader process underpinning the differential response to massed and spaced stimuli has not been theoretically or computationally investigated. A general mechanism of the spacing effect, capable of explaining the observations across different model systems and learning regimes, has not been identified to date.
An analysis of Supplemental Table S1 shows that existing models of LTM formation and the spacing effect share recurring similarities in how the molecular components of the signaling network are wired together. All models describing the differential response to spaced and massed stimulation include either feedforward or feedback architectures, which suggests their potential importance in understanding the underlying mechanisms of the spacing effect. For instance, feedforward network architecture is seen in a model involving the interaction between protein kinase A (PKA) and extracellular signal-regulated kinase (ERK) pathways (Zhang et al. 2012). PKA and ERK signaling cascades, necessary to induce long-term facilitation (Kandel 2012), have been suggested to be the underlying factors generating the spacing effect observed in Aplysia (Naqib et al. 2012; Zhang et al. 2023). This feedforward motif is also a key component of the study by Zhang et al. (2012), who investigated the effect of interactions between the two cascades in response to serotonin (5-HT) stimulation. They show that for an appropriate interval between the 5-HT stimulations, the fast PKA response to one signal may overlap with the delayed ERK response to the preceding signal, significantly enhancing the overall response.
Feedback regulatory interactions are also known to be present in systems exhibiting the spacing effect. Studies using mice and Aplysia models have shown that cAMP response element-binding protein (CREB) activity is important for LTM (Alberini et al. 1994; Bourtchuladze et al. 1994; Bartsch et al. 1995; Kogan et al. 1997), and may also determine the optimal intertrial interval and the number of trials required for LTM consolidation (Kogan et al. 1997). Upstream regulators of CREB, mitogen-activated protein kinase (MAPK), and Ca2+/calmodulin-dependent protein kinase II (CaMKII) are also believed to play a role in determining the effective training regime for maximal LTM (Ajay and Bhalla 2004; Philips et al. 2013a,b; Smolen et al. 2016). A feedback loop involving CREB1 was found to be essential for the consolidation of long-term synaptic facilitation in Aplysia (Liu et al. 2008). A model for differential translocation of protein kinase C (PKC) in Aplysia shows how the presence of feedback components in the pathway enables the neurons to respond differently to massed and spaced applications of 5-HT (Farah et al. 2009; Naqib et al. 2011; Farah et al. 2015). Several other studies have suggested the importance of specific positive feedback loops in the formation of LTM (Bhalla and Iyengar 1999; Song et al. 2007; Liu et al. 2008; Smolen et al. 2008, 2012; Aslam et al. 2009; Bambah-Mukku et al. 2014).
The existing experimental and mathematical models have used different metrics to compare the effect of training protocols on LTM formation. These include peak amplitude or cumulative activity of key molecular components. For instance, Zhang et al. (2012) optimized the spacing between the training sessions, maximizing the peak overlap of PKA and ERK activities in their model. On the other hand, the metric examined in the Farah et al. model is the translocation of PKC Apl II. The regulation of this translocation differs depending on whether the stimulation is spaced or massed (Farah et al. 2009). Since these models are designed to simulate specific systems, the relevant metric is used, and a direct comparison between different models may not be informative or advisable.
The investigation of how various network motifs respond to different types of input stimuli is a well-explored field that often uses analytical and numerical strategies to delineate possible motif dynamics (Alon 2020). Most of the research on motif input–output relationships focuses on the ability of the motifs to retain the memory of input stimuli, detect fold changes, filter stimuli, or on the phenomenon of adaptation or homeostasis. There is a notable absence of studies that analyze motif dynamics in response to nonstandard inputs, such as a limited number of periodic pulses or step changes that are representative of learning protocols. None have investigated the response to spaced/massed inputs, and the closest study is for the response to periodic stimuli. For single-branch feedforward motifs, a given input dose (amount) can induce different outputs depending on the frequency, amplitude, and duration of the input (Fletcher et al. 2014). In another significant study, feedforward and feedback loops exposed to trains of periodic pulses were analyzed. This research (Cournac and Sepulchre 2009) describes the ability of the motifs to maximize their responses to periodic stimulations under different conditions, providing insights into the formation of LTM and long-term potentiation (LTP).
To our knowledge, none of the existing studies have specifically investigated the potential of motif dynamics in elucidating the spacing effect in a manner that is independent of the animal model, training protocol, biomolecular components, and the timescales involved. Hence, instead of focusing on specific molecular components or signaling pathways, we aim to explore the properties of frequently occurring network motifs in terms of describing the LTM formation and the spacing effect. Using simple network motifs as a starting point, we computationally identify motifs that can qualitatively replicate the experimentally observed characteristics of the spacing effect, in particular, the existence of an optimal interstimulus interval (ISI).
Results
In this work, we have developed a common training protocol and defined six different metrics to quantify the response of 41 motifs to spaced and massed inputs. We have identified motifs that are capable of exhibiting the inverted U-shaped response that is characteristic of the spacing effect, and tested whether their capability is metric-dependent. We have shown that our results are robust to variation in the number of pulses, duration of individual pulses, and the choice of response element in the motif.
A common computational protocol to investigate the effect of motif structure
To identify minimal network architectures capable of replicating the spacing effect characteristics, particularly the presence of an optimal ISI, we formulated ordinary differential equation (ODE)-based models of frequently occurring biological network motifs in learning and memory. The 41 mechanisms considered in this study include positive and negative autoregulation (PAR and NAR), positive and negative feedback loops (PFBLs and NFBLs), coherent and incoherent feedforward loops (CFFLs and IFFLs), and linear activation and inhibition cascades (ACs and ICs). The effect of changes in the motif architecture on its dynamics was examined by introducing additional intermediates, different modes of motif activation, and linear conversion reactions. All 41 motifs and the corresponding systems of ODEs are provided in Supplemental Section 2.
Figure 1A provides an overview of the models examined in this study. Each motif model includes an input (S) and a response element that represents the output (see Fig. 1A). We quantified the response (R) to stimulation using three measures that are frequently used in experimental settings and computational models: (i) concentration (Rcon), (ii) peak concentration (Rmax), and (iii) cumulative activity (Rtot) of the response element, measured at either of two time points used in experiments, as described in the Materials and Methods section. To ensure consistency and comparability, each ODE model was nondimensionalized by rescaling the system of ODEs using the kinetic constants associated with the formation and degradation of the response element.
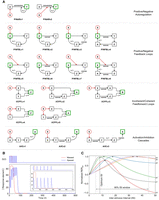
(A) Summary of motif models studied: Signal element S is highlighted in red, and the response element in green. X, Y, Z, A, and B denote the biomolecular species in each model. Catalytic activation and inhibition are indicated by + and − signs, respectively. See Materials and Methods for details of notation used and Supplemental Material for details of all 41 motifs. The bottom panel (B and C) depicts the simulation results for the CFFLv4-OR motif stimulated using six input pulses. (B) The concentration of response element following massed and spaced applications of six pulses for a single parameter set. The concentration, time, and ISI are shown in dimensionless units (d.u.). The inset plot shows the concentration of the response element when ISI is increased to 50 d.u. (C) Normalized RERtot values, computed at tf using Equation 2, for CFFLv4-OR as a function of ISI show inverted U-shaped curves for several parameter sets, indicating the existence of optimal ISI. The highlighted black curve corresponds to the parameter set whose time series is depicted in (B). For parameter values used, see Supplemental Table S2.
A frequently used protocol in experimental studies to induce long-term facilitation in Aplysia involves delivering five 5 min pulses of 5-HT, each separated by a uniform 15–20 min ISI (Montarolo et al. 1986; Mauelshagen et al. 1998). In this study, we use three, six, and nine square wave pulses with constant amplitude and duration and constant ISI between consecutive pulses for spaced training. The corresponding massed training was carried out by administering all the individual pulses immediately after one another with no ISI. Two distinct training (stimulation) protocols (see Fig. 2A,B) were used: dose-conserved (DC) and single-pulse-duration-conserved (SPDC). In the DC protocol, the total amount of input remained constant regardless of the number of input pulses. This facilitated an analysis of how alterations in the temporal distribution of the total input influenced the response of the motif models. In the SPDC protocol, we maintained a constant single pulse duration for all spaced training sessions, such that increasing the number of input pulses during spaced training results in a higher cumulative stimulus dose administered. As with the DC protocol, each spaced response was compared to a massed stimulus with the same total dose.
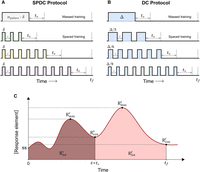
Stimulation protocols, each involving massed training and the corresponding spaced training using three, six, and nine pulses
with a constant ISI, denoted by i, and unit amplitude. (A) SPDC protocol: Duration of spaced pulses (δ) is fixed, with corresponding massed pulse duration npulses × δ for different npulses. (B) DC protocol: Massed pulse duration (Δ) was equally divided into three, six, and nine spaced pulses. In both protocols, the
response was calculated at time  relative to the final stimulation pulse ending at time ε, and at a fixed tf. (C) Quantification of response: Response to stimulation was quantified using concentrations of the response element (denoted
as
relative to the final stimulation pulse ending at time ε, and at a fixed tf. (C) Quantification of response: Response to stimulation was quantified using concentrations of the response element (denoted
as  and
and  ), peak response concentrations (
 and
and  ), and cumulative activity (
 and
and  ), all sets corresponding to the two measurement times,
  and tf, respectively.
Numerical simulations of the motif models were performed using 50,000 randomly generated parameter sets that consist of kinetic constants and pulse duration values. Parameter sampling used the Latin hypercube (LH) sampling method. Kinetic constants were sampled from a uniform distribution in logarithmic scale ranging from 10−3 to 103 d.u. Similarly, pulse duration values, δ and Δ, were sampled from 0.01 to 10 d.u. and 0.1 to 100 d.u., respectively. In each case, the two training protocols were administered at the unstimulated steady state as forcing functions to the system of ODEs (see Materials and Methods for details). The response measurements were carried out either at a specific time point relative to the last stimulus (tv) or at a fixed time not dependent on the stimulus duration and ISI (tf), as outlined in Figure 2. The response following spaced training was compared with the corresponding massed training to determine the relative enhancement in response (RER, Equation 1), quantified using one of the six response metrics (Fig. 2C and Materials and Methods). Following the numerical simulations, parameter sets replicating the spacing effect observations were identified by plotting the RER values as a function of the ISI, with ISI varied from 0 to 50 d.u. (see Materials and Methods). Starting with zero ISI corresponding to massed training, the “spacing effect” response associated with LTM is characterized by a gradual increase in the RER with ISI, a maximal response at the optimal ISI, followed by a decrease in the RER for larger ISI.
Through a filtering process, such inverted-U responses were computationally identified. For each model, the parameter sets that resulted in monotonic RER curves (as a function of ISI), as well as massed response values below the specified minimum significant response threshold of 10−4 d.u., were filtered out. The remaining parameter sets, which passed this filtering stage, were used to repeat all simulations with finer ranges of ISI values. A parameter set was deemed “suitable” only if at least one of the six RER curves displayed an inverted U-shaped pattern, as defined in the Materials and Methods section. An illustrative example of a simulation that leads to RER curves qualitatively matching the spacing effect is presented in Figure 1B and C. Following this simulation protocol, parameter sets show that the spacing effect was identified for all motifs, and the results are summarized in Figure 3. It is important to note that the absence of parameter sets does not prove the inability of these models to generate an inverted U-shaped response curve. The number of parameter sets is, at best, a qualitative indicator of the capability of the model to generate the spacing effect, and as such, it may not be suitable for quantitative comparison between different models.
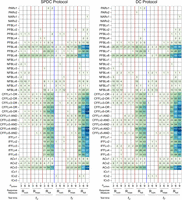
Simulation results for SPDC and DC protocols: Cells show the number of parameter sets that replicate the spacing effect for each motif model for different combinations of response measures, number of input stimuli, and the time of response measurement. Successful replication of the spacing effect was assumed to result in an inverted U-shaped (normalized) RER curve that satisfies the constraint parameters detailed in Supplemental Material when stimulated using three, six, or nine pulses.
Positive feedback loops replicate the spacing effect across all response metrics
We formulated two categories of feedback models where the stimulus either enhanced the formation of the first component (denoted
by X) in the loop (P/NFBLv1 to v4) or initiated an interaction involving the first two components (P/NFBLv5 to v8). Hence,
in P/NFBLv5 to v8, the feedback loop is completed only when the stimulus is present, which initiates the regulatory interaction
or the conversion process. Figure 3 presents the number of parameter sets that generate the spacing effect characteristics when analyzed using one of six response
metrics ( ,
,  , and
, and  ) for each motif, protocol, and different input pulses. Several variations of the feedback motifs formulated exhibited the
spacing effect in the form of an inverted U-shaped RER curve.
) for each motif, protocol, and different input pulses. Several variations of the feedback motifs formulated exhibited the
spacing effect in the form of an inverted U-shaped RER curve.
In particular, PFBLv6 and PFBLv8 replicate the spacing effect across all response metrics regardless of the number of input pulses administered and the timing of the response measurement (see representative simulation result for PFBLv6 in Supplemental Fig. S10). Even with a minimum RER threshold as high as 100%, indicating a requirement for at least a twofold increase in the spaced response relative to the massed response, several parameter sets can be observed to produce the desired characteristics (Supplemental Fig. S7). Both positive autoregulation and positive feedback motifs are recognized mechanisms for inducing bistability in biological systems under proper circumstances. Examination of the time series of the response element showed that none of the parameter sets responsible for producing the spacing effect in PFBLv6 and v8 caused a transition to a second steady state in response to the stimulus (results not shown). Hence, the observed ability of the motif to exhibit the spacing effect characteristics is not reliant on bistability, as the parameter sets demonstrate the spacing effect even when bistability is absent.
With negative regulation, NFBLv6 and v8 produced the spacing effect features with all response measures at both measurement times, except when analyzed with Rmax. Spaced trials enhance the negative feedback exerted on the response element, ultimately reducing its concentration. Only a few parameter sets and motif combinations yielded a spaced response enhancement exceeding 10% when quantified using the Rmax and Rcon measures, irrespective of the time point of response measurement. A distinguishing factor between P/NFBLv6 and v8 compared to v5 and v7 is the presence of conversion of the response element that is directly modulated by the stimulus. Hence, the ability of these two motifs to exhibit the spacing effect could be attributed to the presence of conversion reactions. Since an inverted U-shaped response was not observed in analogous motifs (P/NFBLv2 and P/NFBLv4), it may be concluded that the conversion reactions alone are insufficient to generate the spacing effect. Instead, a combination of conversion reactions and the indirect activation of the motif is necessary to observe the characteristics associated with the spacing effect in the feedback models analyzed in this study.
For the same topology, apart from S(t), the process directly affected by the stimulus greatly influences the nature of the response. Specifically, for the motifs labeled as P/NFBLv1 to v4 (with the same topology as PFBLv5 to v8 discussed previously), spaced training with different ISI did not produce the expected inverted U-shaped curve for almost all of the parameter sets examined. In terms of Rtot, the response produced by these models following spaced trials was similar to the response produced for massed trials across all parameter sets. Due to the direct influence of the stimulus strength on the response element, any fluctuations in the response element's concentration mirrored changes in the stimulus level. Consequently, the off-states of the stimulus coincide with a sharp decrease in the response element concentration, resulting in a small enhancement or reduction in the spaced response relative to the massed response. In contrast, several parameter sets demonstrated the desired characteristics across the response metrics when the stimulus regulates the response element indirectly through changing its conversion rate or the activation reactions mediated by the response element (motifs P/NFBLv5 to v8).
Response of feedback motifs is robust to the choice of response element
In the analysis depicted in Figure 3, we considered the first component (X) as the primary response element for all feedback models. In this scenario, the same element's concentration was directly influenced by the stimulus state, either augmenting or diminishing it through conversion to a hypothetical activated form, as observed in PFBLv6 and v8 (Supplemental Fig. S10). As a result, the instantaneous effect of the stimulus on the response in feedback models is more pronounced compared to that in feedforward and linear cascade models, where the impact of stimulus state changes is transmitted indirectly through sequential regulatory interactions or conversions. We repeated the simulations for response calculation based on the levels of Y, Z, and A in the feedback loops (instead of the level of X). For consistency, concentrations and parameters for each model were rescaled again using the designated response element's formation and degradation rate constants. Modifying the designation of the response element within these two motifs did not influence their capacity to respond differentially to spaced training and manifest the spacing effect. Even when the designated output element was different, these models exhibited robustness in their ability to generate a response corresponding to the spacing effect (Fig. 4; also see Supplemental Fig. S8).
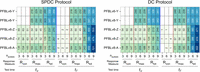
Robustness to the choice of response element: PFBLv6 and v8 consistently displayed an inverted U-shaped RER curve, regardless of the choice of response element. Each cell in the visualization denotes the number of parameter sets (out of 50,000 randomly generated parameter sets) replicating the spacing effect for PFBLv6 and v8 models using Y, Z, and A as the response element.
Feedforward loops exhibit response measure-dependent spacing effect
The type-1 CFFLs examined in this study incorporated the convergence of the two pathways on the response element using AND and OR logic. In contrast, the negative regulation in type-1 IFFLs was designed to attenuate the formation of the response element. All feedforward loops exhibited characteristics of the spacing effect when the total amount of the response element was taken as the response measure. Remarkably, this finding held true regardless of the logic used to integrate information from the two individual arms of the feedforward architecture. The spacing effect was observed irrespective of whether the response element concentration depended on a multiplicative (logical AND) or additive (logical OR) combination of outputs from individual arms. It also did not depend on the type of regulation applied (positive or negative). Type-1 CFFL is known to rapidly respond to step-like stimuli in one direction while exhibiting a delayed output to step changes in the opposite direction (Mangan et al. 2003). An OR gate has been previously shown to result in a persistent output due to the delayed activity of the slower arm following the off-state of the stimulus. An ISI close to this temporal delay is expected to augment the cumulative response, as the response to one stimulus pulse can overlap with the response to the subsequent one. However, here we find that this delay is not essential. For instance, though the delay is absent in CFFLs with an AND gate, all such motifs examined in this study also show enhanced response following spaced training.
In the feedforward motifs, it was observed that the concentration of the response element remained above the steady-state level for a brief period following each pulse of stimulation. In other words, the transient peaks in response concentration persisted longer than the duration of each stimulus. Consequently, when the ISI values are closer to the lifetime of the response element, the activity induced by each individual input pulse accumulates, leading to a significant enhancement in the response (measured using Rtot). Extending the ISI value beyond this optimal range eliminated the cumulative effect and resulted in distinct, well-separated transient pulses in the response concentration, which remained constant for higher ISI values (see Fig. 1B, inset plot and Supplemental Fig. S11). Consequently, it may be inferred that the key factor influencing the capability of feedforward models to generate an inverted U-shaped response is not the delay in the activity of the slower arm. However, no consistent pattern in the results could be discerned when other measures were used. Only a few motifs in combination with either Rcon or Rmax as the response measure showed an inverted U-shaped response (Fig. 3).
Linear activation cascades are sufficient to generate the spacing effect
Simple linear cascades of response activation and inhibition were examined to compare the roles of feedback and feedforward
elements in generating an inverted U-shaped response curve. The three models consist of sequential activation (or conversion)
of biomolecules that lead to either the activation (AC) or inhibition (IC) of the response element. The numerical simulations
of these models indicate that the three AC models generate response curves with the required characteristics for both training
protocols and Rmax, Rtot response measures (Fig. 3). When using the  metric, none of these three models displayed the spacing effect as defined by the criteria specified in the Materials and
Methods section for any of the three input pulses. In all other cases, ACv1, v2, and v3 demonstrated the spacing effect due
to the greater lifetime of the response element relative to the stimulus duration, as seen in the feedforward models (see
Supplemental Fig. S12).
metric, none of these three models displayed the spacing effect as defined by the criteria specified in the Materials and
Methods section for any of the three input pulses. In all other cases, ACv1, v2, and v3 demonstrated the spacing effect due
to the greater lifetime of the response element relative to the stimulus duration, as seen in the feedforward models (see
Supplemental Fig. S12).
Robustness to changes in stimulus duration
To assess the robustness of the identified motifs and parameter combinations, we conducted systematic variations in the stimulus durations (δ and Δ), allowing for up to a twofold increase or decrease. Notably, we observed that most of the kinetic parameter sets initially identified as effective in generating the spacing effect continued producing similar outcomes when stimuli with different durations were administered. For instance, the results of the parameter variation analysis for the PFBLv6 and CFFLv4-OR motif are presented in Figure 5. Small changes in the single pulse duration for the SPDC protocol (δ) and the massed pulse duration for the DC protocol (Δ) had negligible influence on the ability of identified models to generate the spacing effect. It was noted that as the pulse duration varied, the corresponding optimal ISI also exhibited variations. This analysis was limited to the parameter sets where spaced stimuli with altered pulse duration could be delivered before the measurement time tf.
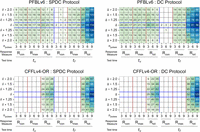
Results of parameter variation for PFBLv6 and CFFLv4-OR using SPDC and DC protocols. Each subfigure describes the number of parameter sets replicating the spacing effect when the pulse duration values (δ and Δ) in the selected parameter sets (Fig. 3) were varied by factors of 1.25, 1.5, and 2. In each subfigure, the middle row corresponds to the original number of parameter sets that exhibited the spacing effect, as shown in Figure 3.
Discussion
The intricate molecular circuits contributing to LTM formation and cellular analogs of memory, such as LTP, are composed of several network motif architectures. This study attempts to test the ability of these individual motifs to qualitatively replicate the experimentally observed characteristics of the spacing effect, defined here as an inverted U-shaped response to increasing values of ISI. To enable comparison across motifs, we define a common training and test protocol to identify responses having the spacing effect characteristics. We formulated two stimulation protocols, one where the duration of a single pulse is conserved and another where the total dose is conserved irrespective of the number of pulses. In either case, the corresponding equal-dose massed input is used for comparison. Six different metrics were used to quantify the response to stimulation, all based on the concentration of the response element in the motif. The choice of the response element within each motif model might be considered as an implicit parameter of the model. While in autoregulation motifs, feedforward motifs, and linear cascades, it seems natural to designate the final element as the “output,” this generalization becomes challenging in feedback motifs due to their cyclic nature. Our results indicate that even if another component is designated as the response element for feedback motifs, the capacity of these motifs to generate the spacing effect is qualitatively preserved (see Fig. 4; Supplemental Fig. S8). Hence, the results presented are not dependent on which element is selected as the response variable. As used in our study, a single concentration or a function of a single concentration is the simplest response measure for comparison across motifs. However, functions of multiple concentrations may be the appropriate response measure in some circumstances. For instance, the peak level of the product of PKA and ERK activation has been used (Zhang et al. 2012, 2021) to compare the response to stimulation protocols. These results may possibly change if functions of multiple variables are used to quantify the response.
Though we have carried out simulations for a wide range of parameters, it is not possible to exhaustively explore all the theoretically possible parameter space. For example, across all models examined in this study, we used a Hill coefficient of 5, and verified that there are no discernible qualitative shifts in the outcomes depicted in Figure 3 when cooperativity is varied by decreasing this coefficient (see Supplemental Fig. S15). Similarly, the results remained robust to changes in the thresholds associated with the constraints that define the spacing effect, such as the minimum significant massed response cutoff (see Supplemental Fig. S16). Each kinetic mechanism is characterized by its unique set of reaction rate constants, contributing to the complexity of the models under study. The parameter sampling was carried out such that the process generates a fixed number of parameter sets (n = 50,000) for the numerical simulations of each model. The outcomes presented in our study are confined to the parameter space explored in the sampling process. Our analysis has focused on equally spaced square wave input pulses rather than optimizing the response for unevenly spaced input stimuli, as demonstrated by Zhang et al. (2012) in their novel study. Considering unequal spacing of input stimuli across all motif combinations, protocols, and response measures would necessitate an extensive number of numerical simulations. Nevertheless, it is important to recognize that parameter sets and motifs previously deemed inadequate in replicating the spacing effect might indeed exhibit an inverted U-shaped response when exposed to unevenly spaced input stimuli.
From an analysis of the response of the 41 distinct mechanisms tested, we find that PFBLv6 and PFBLv8, variations of the positive feedback motif, consistently show the potential to generate the spacing effect irrespective of the measure used to quantify model response. On the other hand, all feedforward loops, regardless of their mechanisms and type of regulation, show a response measure-dependent spacing effect, particularly when analyzed using the cumulative activity of the hypothetical response element. Our results also show that a simple cascade of sequential activations and conversion reactions is sufficient to evoke a spacing effect similar to those observed in feedback or feedforward mechanisms. These observations underscore the diversity of mechanisms capable of generating the spacing effect and hint at fundamental principles governing these effects within network architectures.
We have used several combinations of response metrics and testing protocols to check whether the conclusion of a motif's ability
to generate an inverted-U response to increasing ISI is dependent on the choice of stimulus sequence or response metric. The
results presented in Figure 3 indicate no qualitative difference between the two training protocols studied. No generalizable pattern could be identified
for any combinations of motifs, response measures, and test times. The columns corresponding to the  metric in Figure 3 display a relatively fewer number of parameter sets compared to the columns corresponding to the other metrics. This effect
is because following the last stimulus pulse, the concentration of the response element decreases and is smaller in most parameter
sets due to the significant temporal separation between the input signal and test time. For other measures (peak, cumulative
concentration), the values are not as dependent on the measurement time. Therefore, among the three response measures examined
in this study, the Rcon measure appears more sensitive to changes in test time. In contrast, the Rmax and Rtot measures exhibit lesser dependency on the time of response measurement.
metric in Figure 3 display a relatively fewer number of parameter sets compared to the columns corresponding to the other metrics. This effect
is because following the last stimulus pulse, the concentration of the response element decreases and is smaller in most parameter
sets due to the significant temporal separation between the input signal and test time. For other measures (peak, cumulative
concentration), the values are not as dependent on the measurement time. Therefore, among the three response measures examined
in this study, the Rcon measure appears more sensitive to changes in test time. In contrast, the Rmax and Rtot measures exhibit lesser dependency on the time of response measurement.
For a few models, namely NARv2, P/NFBLv1, and ICv1/3, no stimulation protocol leads to an inverted U-shaped curve for any parameter set. Since the conclusions drawn are based on the specific constraints used and the parameter space simulated, the absence of such a response is merely indicative of, but does not prove, the inability of the motif to produce such responses. We show that motif architecture with only sequential connectivity, i.e., no feedback or branching/feedforward connections, can also result in a response corresponding to the spacing effect. This effect, as for the other motifs, is associated with prolonged lifetime (or delayed deactivation) of the response element. This dependence on persistence or build-up of molecular components during intertrial intervals, which are otherwise absent or reduced during massed training, has also been previously reported, for instance, in the studies on PKC Apl II translocation in Aplysia (Farah et al. 2009; Naqib et al. 2011; Zhang et al. 2012). A sequential cascade involving only conversion reactions is insufficient to produce such an observation (Supplemental Fig. S9; see Supplemental Section 8 for details). Models ACv1-3, which display the spacing effect, each incorporate at least one catalytic activation step. For the motifs and parameter combinations assessed here, if this catalytic step is absent, the spacing effect is not observed. This ability of linear cascades to realize the spacing effect also provides insights into why feedforward mechanisms display the spacing effect regardless of the type of regulation and the gating logic. The similarity observed between the parallel pathways in the feedforward motifs and ACs suggests that each individual pathway may possess the capability to induce the spacing effect when analyzed using the Rtot measure. Consequently, the spacing effect observed in the combined pathway is independent of the logic (AND/OR) combining the response from individual arms.
To test this result using a model that incorporates more specific biochemical kinetics relevant to the formation of LTM, the individual feedforward pathways (Supplemental Fig. S13) of the Zhang et al. (2012) model were examined using the stimulation protocols formulated in this study (see Supplemental Section 10 for details). When subjected to the spaced stimulations with different numbers of input pulses, these individual pathways were able to generate inverted U-shaped responses to increasing ISI (Supplemental Fig. S14A,B), thus supporting our observation from this study.
Every molecular signal transduction network is a combination of several motifs. This study may help identify the critical elements of such networks, and help define the roles of other elements in modulating the response or helping generate robust responses. Positive feedback loops have been established as pivotal elements in several models of memory formation and LTP. For instance, it has been shown that positive feedback regulation of local brain-derived neurotrophic factor (BDNF) protein synthesis could play a significant role in underpinning three critical properties of LTP (Hao et al. 2018). Therefore, such network topologies could also potentially be an integral part of the molecular network responsible for realizing the spacing effect at the cellular level. However, a mechanistic or mathematical explanation of why some motifs show such a robust metric-independent spacing effect, and others fail to show this effect for the tested parameters, has not yet been established.
In summary, this investigation explored the behavior of basic network motifs in eliciting an inverted U-shaped response to increasing intervals between input signals. Our analysis identified the capacity of feedforward and feedback architectures in exhibiting spacing effect characteristics, and the dependence of this capacity on the response measure. These insights shed light on the potential role of network topology in memory-related phenomena, and will contribute toward the development of a conceptual framework for further exploration and understanding of memory processes within biological systems.
Materials and Methods
ODE-based models of biological network motifs (Fig. 1A; Supplemental Fig. S1) were formulated (see Supplemental Section 2 for ODEs) to identify mechanisms capable of exhibiting the spacing effect. The models were numerically simulated for different sets of randomly generated parameter values. For each parameter set, the ISI was systematically varied stepwise during spaced training. The spacing effect characteristics of each model were analyzed in detail by comparing the spaced training response obtained for different ISI values with the massed training response, using constraints to identify response curves representing the spacing effect.
Motif models
Network motifs formulated include PAR and NAR, CFFLs and IFFLs, PFBLs and NFBLs, and linear ACs and ICs. For each type, motifs tested include those with additional intermediates (e.g., two intermediates in the feedback loop instead of one), changes in the mode of motif activation (signal increasing the formation rate or changing the conversion/degradation rate), and conversion reactions (instead of catalytic enhancement) (Fig. 1A; Supplemental Fig. S1).
It was assumed that each motif would be contained within a single compartment and comprises two common components: a signal element (S; input) and a response element (output). All the molecular species not formed by conversion were assumed to form at a constant (zero order) rate and undergo first-order degradation. Regulatory interactions were assumed to follow Hill function kinetics. For ease of analysis, the concentrations and timescales for the set of ODEs corresponding to each motif were rescaled using the degradation rate constant (units time inverse, whose inverse provided a timescale) and formation rate constant of the response element (units concentration/time, which after normalizing the time, provided a concentration scale). The resulting nondimensionalized ODEs, which express time and concentrations (and therefore, parameters) as dimensionless ratios, were used for numerical simulations and further analyses (see Supplemental Section 3 for details).
Two categories of autoregulation motifs were tested, where the signal influences either the formation rate of X (PARv1 or NARv1 in Supplemental Fig. S1) or the formation of Y as a function of X (conversion or catalysis, e.g., PARv2, NARv2 in Supplemental Fig. S1). Likewise, two types of models (e.g., PFBLv1-4 and PFBLv5-8, and NFBL equivalents in Supplemental Fig. S1) were developed for feedback loops. Three and four-component feedback models were formulated and analyzed with conversion, activation, and inhibition reaction combinations. Coherent feedforward motifs can combine the signals from their two parallel paths that lead to the response in different ways. A requirement for both pathways to be activated for the formation response element was captured by an AND gate, mathematically represented as a product of two Hill function forms. Response due to the activation of at least one pathway (OR logic) was captured by a single Hill function of the sum of species concentrations. In the incoherent feedforward models, the negative regulation was incorporated into the model as an attenuation factor to the rate of response element formation. Since there are numerous possible variations of incoherent and coherent feedforward mechanisms, we have restricted our study to variations of the type-1 feedforward mechanism (Mangan and Alon 2003). Finally, three linear activations (ACv1-3 in Supplemental Fig. S1) and inhibition (ICv1-3 in Supplemental Fig. S1) cascade models were also included to compare the effect of feedback and feedforward regulations on the response and the spacing effect.
Training (stimulation) protocols
The signal (input) strength, a forcing function to the system of ODEs, acts as a proxy for the type of training administered. Training protocols represent how signal level (S) varies in the model with time (Fig. 2A,B). Square wave pulses of constant amplitude and equal ISI between consecutive pulses were used as the standard input. Spaced training was simulated using input pulses with nonzero ISI and massed training using an ISI value of zero, as illustrated in Figure 2. The square wave signal amplitude was assumed to be equal to 1 during the on-state and 0 during the off-state.
We define two stimulation protocols in this study: SPDC and DC. Each protocol has massed and spaced training using three, six, and nine pulses (Fig. 2). In the SPDC protocol, the duration of a single pulse (δ) in spaced training was fixed for all three training sessions. The corresponding massed training sessions were performed using a continuous pulse with a total duration of δ × npulses. Hence, for any value of single pulse duration (δ), the three-pulse SPDC protocol and its associated massed stimulus have half the total dose as the six-pulse SPDC protocol and its corresponding massed stimulus. On the other hand, in the DC protocol, the massed pulse duration (Δ) was divided into equal durations for the individual pulses in spaced training sessions. Therefore, regardless of the massed pulse duration, the total amount of signal element administered remains the same in massed and all three spaced stimulations (DC).
Quantification of response
Each protocol is further divided based on the time at which the response is measured. In both protocols, all response measurements
were performed at two different time points: (i) at  , a fixed time after the administration of the last pulse, and (ii) at tf, independent of the time when the last pulse is administered (see Fig. 2). The time point where the administration of the last pulse concludes is denoted by ε.
At each of these times, the molecular response to stimulation was quantified using the following six distinct metrics, as depicted in Figure 2C.
-
Response element's concentration at
 and
and  .
.
-
Peak response concentration observed between 0 to
 and 0 to
  .
.
-
Cumulative response (area under the concentration–time curve) in the intervals from 0 to
 and 0 to
  .
.
The metrics  and
and  are identical if the response peak occurs before
  . The response to spaced stimuli was normalized using the corresponding massed training response, for each parameter set,
protocol, and motif. The response to spaced stimuli was represented as the relative deviation from the response to massed
stimuli. This scaled value is referred to as the RER hereafter, and defined by Equation 1.
. The response to spaced stimuli was normalized using the corresponding massed training response, for each parameter set,
protocol, and motif. The response to spaced stimuli was represented as the relative deviation from the response to massed
stimuli. This scaled value is referred to as the RER hereafter, and defined by Equation 1. (1)
(1)
The response R in Equation 1 can be quantified using any of the six metrics. Therefore, six different RER readings were obtained for each parameter set
and ISI value:  ,
,  ,
,  ,
,  ,
,  ,
,  . A zero RER value would suggest no difference in the response between spaced and massed training for the specific protocol
and set of parameters. An RER value of one would indicate a 100% enhancement in response following spaced training relative
to the massed-input response.
. A zero RER value would suggest no difference in the response between spaced and massed training for the specific protocol
and set of parameters. An RER value of one would indicate a 100% enhancement in response following spaced training relative
to the massed-input response.
Numerical simulations
For the nondimensionalized motif models, the values of (rescaled) kinetic parameters such as formation and degradation rate
constants were set arbitrarily using LH sampling from a pool of values between 10−3 and 103 d.u. in logarithmic scale. The pulse duration values for the two protocols, δ and Δ, were sampled from 0.01 to 10 d.u. and
0.1 to 100 d.u., respectively. For numerical simulations, 50,000 combination sets of reaction rate parameters and pulse duration
values (δ and Δ) were generated using LH sampling in a logarithmic scale for each motif model. To generate the random numbers
for numerical simulations, the rand function from the random module in the Numpy library (version 1.21.5) was used. The two test times, tf and tv, were set to 600 d.u. and 100 d.u., respectively, for all numerical simulations, and Hill coefficients were set to 5. The
test times were selected such that the individual pulses were administered much before tf, ensuring  .
.
Initially, with each parameter set, the steady-state levels of the molecular species were determined numerically, starting from a zero initial condition and zero input for each motif model. The training protocols were then administered at the steady state as forcing functions to the system of nondimensionalized ODEs. Models were numerically integrated till tf for computing the response to stimulation. The response to massed training was computed for each motif model, parameter set, training protocol, and different numbers of input pulses by setting the ISI to zero. Subsequently, the response to the corresponding spaced stimuli was quantified by systematically varying the ISI values from 0.1 to 50 d.u. The series of response values obtained from spaced training with different ISI values were then normalized using the massed training response using Equation 1.
To identify the motif-parameter set combinations that demonstrate the spacing effect characteristics, including an optimum
ISI, each set of RER measurements was plotted as a function of ISI values. For ease of visualization, RER values corresponding
to each parameter set were normalized by the maximum RER value in the set, such that all values are bounded by −1 and 1 (illustrated
in Fig. 1C). That is, (2)
(2)
In an ideal case showing the spacing effect, RER (equivalently, normalized RER) should initially increase with ISI and then decrease, giving rise to an inverted U-shaped curve. We assumed that such a RER curve should exhibit nonmonotonic behavior, steadily increasing until reaching the maximum and then steadily decreasing, resulting in a single peak. We assumed a significance threshold of 10−4 d.u., and any parameter set resulting in a massed response below this threshold was disregarded. Constraints were also imposed on the (normalized) RER values to avoid situations where they were overly sensitive or insensitive to changes in ISI (see Supplemental Section 4), which could lead to plateauing or sharp peaks. The details of the constraints are provided in Supplemental Section 4.
In brief, a parameter set was considered suitable for generating spacing effect characteristics only if it exhibited an inverted U-shape (as defined by the constraints) for at least one of the six RER curves, as shown in Figure 1C. All numerical simulations were carried out using solve_ivp from the SciPy Python package (version 1.7.3), based on the LSODA and BDF methods. The absolute and relative tolerance values for the solvers were set to 10−10 and 10−8, respectively.
Parameter variation analysis
The stimulus duration values (δ and Δ, respectively, for SPDC and DC protocols) were varied up to a twofold increase or decrease. The specific roles of feedback and feedforward regulations in generating the spacing effect were assessed by simulating the identified combinations of motifs and parameter sets while eliminating the corresponding regulatory interaction from the model. Similarly, all feedback models were reexamined with different species assumed to be the response element, recognizing that within the feedback loops, any component theoretically has the potential to serve as the biological response that leads to LTM formation.
Acknowledgments
C.J.G. acknowledges funding from the Department of Biotechnology, Government of India, through grant BT/PR40128/BTIS/37/43/2022. P.S. acknowledges funding from CSIR through a research fellowship during her PhD.
Footnotes
-
[Supplemental material is available for this article.]
-
Article is online at http://www.learnmem.org/cgi/doi/10.1101/lm.054012.124.
- Received April 4, 2024.
- Accepted June 18, 2024.
This article is distributed exclusively by Cold Spring Harbor Laboratory Press for the first 12 months after the full-issue publication date (see http://learnmem.cshlp.org/site/misc/terms.xhtml). After 12 months, it is available under a Creative Commons License (Attribution-NonCommercial 4.0 International), as described at http://creativecommons.org/licenses/by-nc/4.0/.



