


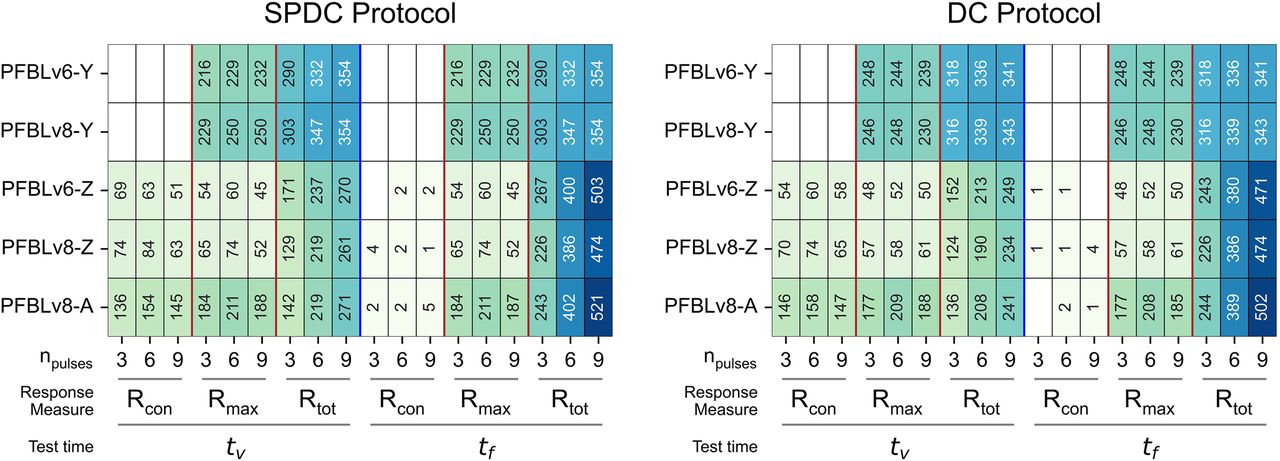
Figure 4.
Robustness to the choice of response element: PFBLv6 and v8 consistently displayed an inverted U-shaped RER curve, regardless of the choice of response element. Each cell in the visualization denotes the number of parameter sets (out of 50,000 randomly generated parameter sets) replicating the spacing effect for PFBLv6 and v8 models using Y, Z, and A as the response element.



