


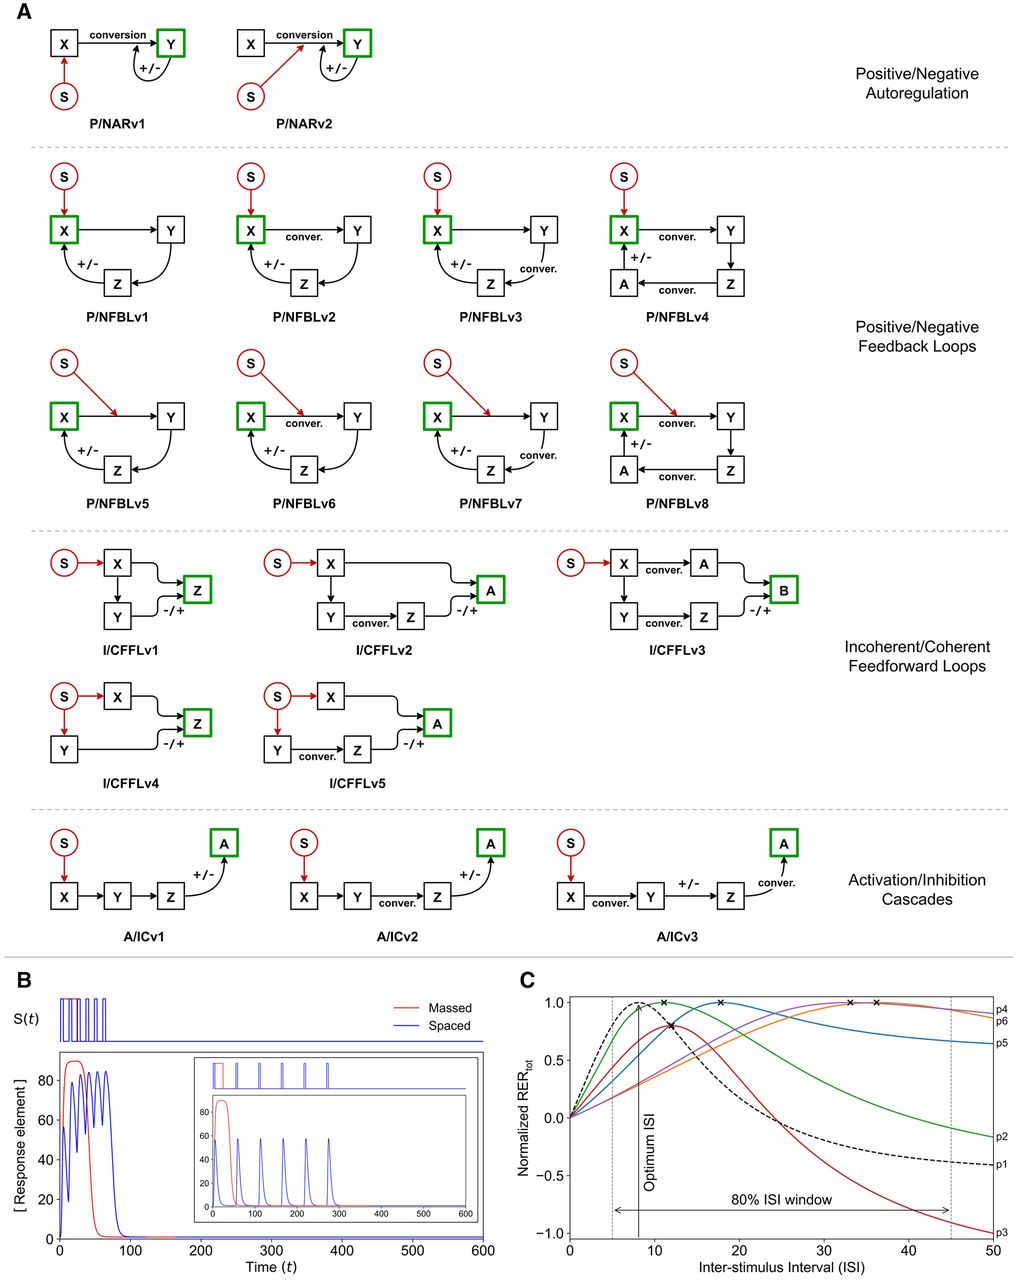
(A) Summary of motif models studied: Signal element S is highlighted in red, and the response element in green. X, Y, Z, A, and B denote the biomolecular species in each model. Catalytic activation and inhibition are indicated by + and − signs, respectively. See Materials and Methods for details of notation used and Supplemental Material for details of all 41 motifs. The bottom panel (B and C) depicts the simulation results for the CFFLv4-OR motif stimulated using six input pulses. (B) The concentration of response element following massed and spaced applications of six pulses for a single parameter set. The concentration, time, and ISI are shown in dimensionless units (d.u.). The inset plot shows the concentration of the response element when ISI is increased to 50 d.u. (C) Normalized RERtot values, computed at tf using Equation 2, for CFFLv4-OR as a function of ISI show inverted U-shaped curves for several parameter sets, indicating the existence of optimal ISI. The highlighted black curve corresponds to the parameter set whose time series is depicted in (B). For parameter values used, see Supplemental Table S2.



