


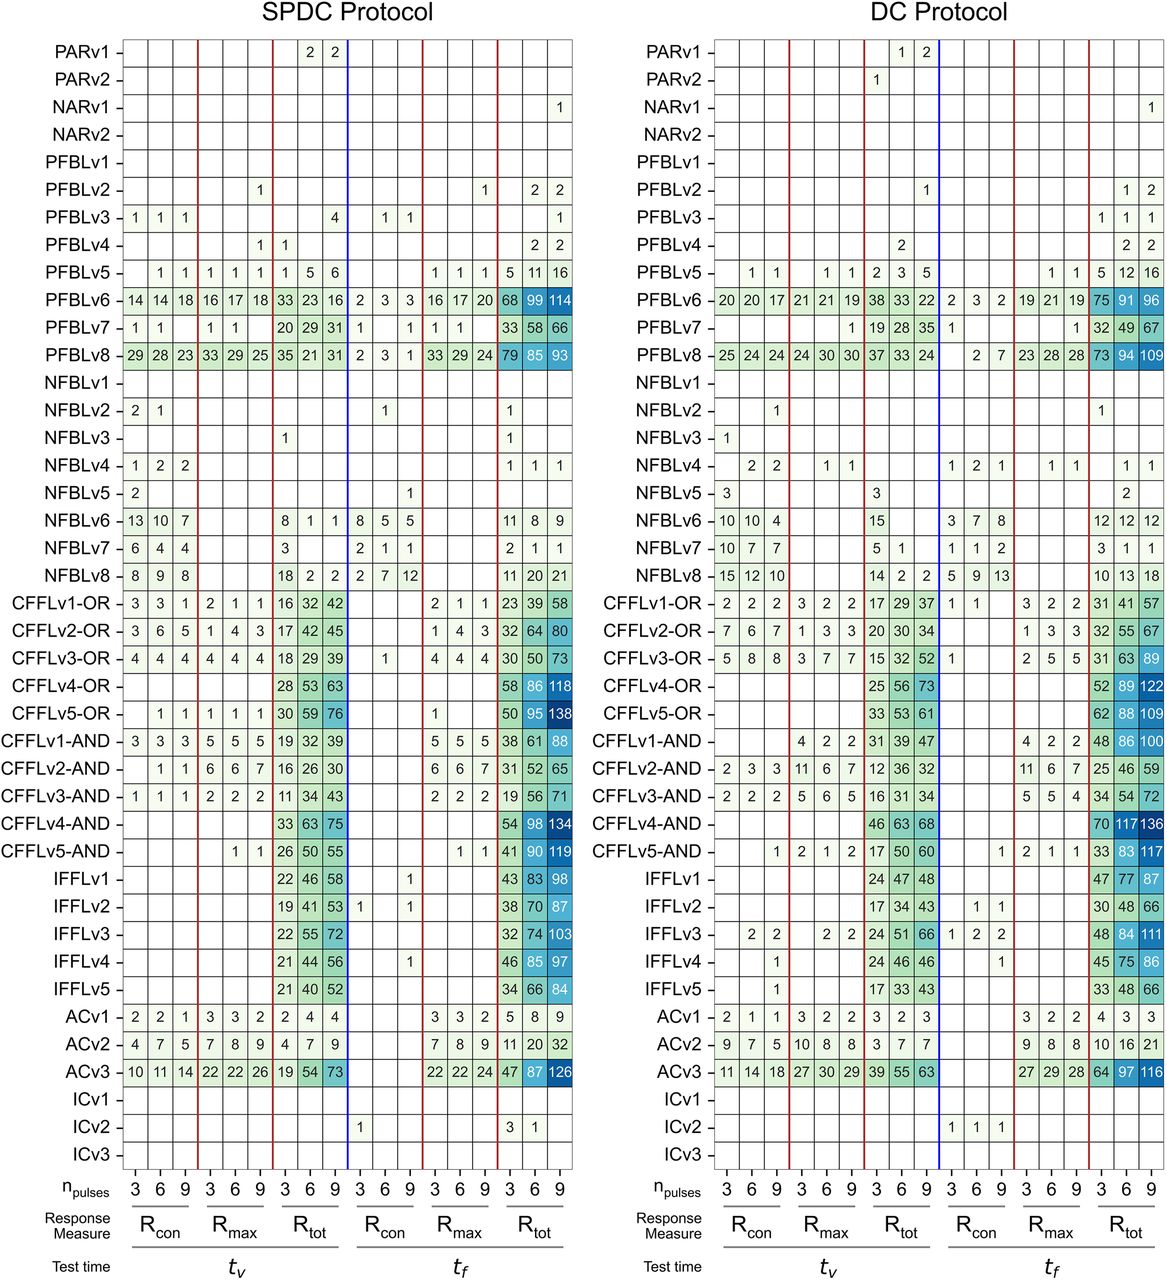
Figure 3.
Simulation results for SPDC and DC protocols: Cells show the number of parameter sets that replicate the spacing effect for each motif model for different combinations of response measures, number of input stimuli, and the time of response measurement. Successful replication of the spacing effect was assumed to result in an inverted U-shaped (normalized) RER curve that satisfies the constraint parameters detailed in Supplemental Material when stimulated using three, six, or nine pulses.



