


Flexible decision-making is related to strategy learning, vicarious trial and error, and medial prefrontal rhythms during spatial set-shifting
- 1Neuroscience Graduate Program, University of Washington, Seattle, Washington 98195, USA
- 2Psychology Department, University of Washington, Seattle, Washington 98195, USA
- Corresponding author: mizumori{at}uw.edu
Abstract
Flexible decision-making requires a balance between exploring features of an environment and exploiting prior knowledge. Behavioral flexibility is typically measured by how long it takes subjects to consistently make accurate choices after reward contingencies switch or task rules change. This measure, however, only allows for tracking flexibility across multiple trials, and does not assess the degree of flexibility. Plus, although increases in decision-making accuracy are strong indicators of learning, other decision-making behaviors have also been suggested as markers of flexibility, such as the on-the-fly decision reversals known as vicarious trial and error (VTE) or switches to a different, but incorrect, strategy. We sought to relate flexibility, learning, and neural activity by comparing choice history-derived evaluation of strategy use with changes in decision-making accuracy and VTE behavior while recording from the medial prefrontal cortex (mPFC) in rats. Using a set-shifting task that required rats to repeatedly switch between spatial decision-making strategies, we show that a previously developed strategy likelihood estimation procedure could identify putative learning points based on decision history. We confirm the efficacy of learning point estimation by showing increases in decision-making accuracy aligned to the learning point. Additionally, we show increases in the rate of VTE behavior surrounding identified learning points. By calculating changes in strategy likelihoods across trials, we tracked flexibility on a trial-by-trial basis and show that flexibility scores also increased around learning points. Further, we demonstrate that VTE behaviors could be separated into indecisive and deliberative subtypes depending on whether they occurred during periods of high or low flexibility and whether they led to correct or incorrect choice outcomes. Field potential recordings from the mPFC during decisions exhibited increased beta band activity on trials with VTE compared to non-VTE trials, as well as increased gamma during periods when learned strategies could be exploited compared to prelearning, exploratory periods. This study demonstrates that increased behavioral flexibility and VTE rates are often aligned to task learning. These relationships can break down, however, suggesting that VTE is not always an indicator of deliberative decision-making. Additionally, we further implicate the mPFC in decision-making and learning by showing increased beta-based activity on VTE trials and increased gamma after learning.
Behavioral flexibility describes the ability to change behavior in response to changing external conditions or internal states (Dalley et al. 2004; Ragozzino 2007; Brown and Tait 2010; Izquierdo et al. 2017; Uddin 2021; Hones and Mizumori 2022). Typical tests of behavioral flexibility involve assessing how well subjects perform tasks that require them to update their behavior as task demands change. In humans, one famous example is the Wisconsin Card Sorting Test (WCST), which requires subjects to learn which stimulus quality (color, number, or shape) is rewarded, sort cards based on the currently rewarded quality, and update sorting strategies when rewarded qualities switch (Grant and Berg 1948; Miyake et al. 2000; Uddin 2021). Similar tasks have been adapted to nonhuman primates (Butter 1969; Mahut 1971; Roberts et al. 1988; Moore et al. 2005; Goudar et al. 2023) and rodents (Kolb et al. 1974; Becker et al. 1981; Ragozzino et al. 2003; Izquierdo and Jentsch 2012).
In rodents specifically, there are two prominent categories of behavioral flexibility tests: reversal learning tasks and set-shifting tasks. Reversal learning tasks involve reward contingency changes, typically such that an opposite response or stimulus selection confers reward (e.g., from turn left to turn right). Set-shifting tasks, however, require shifts between different task rules that dictate possible reward contingencies (e.g., from turn left to alternate between turn directions). Flexibility on either reversal learning or set-shifting tasks is often measured by (1) the number of trials to a certain performance criterion; (2) the number of errors due to the use of a strategy that is no longer rewarded, called perseverative errors; or (3) the overall choice accuracy within blocks of trials, sometimes broken down by proximity to switches. All of these measures revolve around distinguishing between possible different types of error and counting the number of errors in different time periods that are dictated by aspects of the task, which can vary extensively between experiments.
Along with the latent cognitive changes that enable behavioral flexibility, observable behavior is also known to vary. For example, rodents (Tolman 1926; Muenzinger and Gentry 1931; Muenzinger 1938), nonhuman primates (Medin et al. 1970; Resulaj et al. 2009; Kaufman et al. 2015), and humans (Voss and Cohen 2017; Santos-Pata and Verschure 2018) will sometimes appear to pause and/or change the course of a decision as it is carried out, a behavior typically called vicarious trial and error (VTE) but sometimes known as change of mind (Resulaj et al. 2009; Kaufman et al. 2015). Most initial observations of VTE showed that it tended to happen just before or as rats learned a task (Tolman 1926; Gentry 1930; Muenzinger and Gentry 1931; Muenzinger 1938). Since then, multiple studies have shown that VTE tends to occur on more difficult decisions (Bett et al. 2012; Papale et al. 2012, 2016; Schmidt et al. 2013; McLaughlin and Redish 2023), and manipulations that decrease VTE can also impair task performance (Bett et al. 2012; Schmidt et al. 2019; Kidder et al. 2021). This evidence is coherent with the hypothesis that VTE is a marker of deliberative behavior (Redish 2016) and as such suggests that VTE could serve, along with choice outcome, as another candidate for assessing behavioral flexibility.
Although there is support for the general claim that VTE is associated with behavioral flexibility and deliberation, the relationship between VTE and choice outcome is not always clear or consistent across tasks, and most measures of behavioral flexibility rely on evaluating changes in error rates over multitrial timescales. Although some evidence suggests that VTE and associated behaviors are affected over these longer timescales (Papale et al. 2016; George et al. 2023; McLaughlin and Redish 2023), we wanted to measure the association between behavioral flexibility, learning, VTE, and choice outcomes more directly on a trial-by-trial basis, using behavioral measures that could be calculated independently of one another. To do so, we implemented a spatial set-shifting task that required rats to repeatedly switch between blocks of trials in which they had to either continually return to the same location (follow a place rule) or alternate between locations on every trial (follow an alternation rule). We used a recency-weighted Bayesian inference approach that compares choice history to explicitly modeled behavioral strategies and computes the likelihood that each strategy was being used on every trial (Maggi et al. 2024). We identified putative learning points by finding when the target strategy became the most likely strategy for the remainder of the block, and, using changes in likelihoods across trials, we computed a behavioral flexibility score to determine periods of high flexibility that might not be obvious by proximity to learning points or task structure (e.g., block types/switches) alone.
Further, we hypothesized that we should see changes in neural activity if we did indeed identify well-defined measures that meaningfully parsed behavior. Many studies have shown that the rodent medial prefrontal cortex (mPFC) is associated with all of the behavioral measures we were interested in comparing (Pratt and Mizumori 2001; Euston and McNaughton 2006; Rich and Shapiro 2009; Durstewitz et al. 2010; Euston et al. 2012; Hyman et al. 2012; Insel and Barnes 2015; Powell and Redish 2016; Guise and Shapiro 2017; Maggi et al. 2018; Hasz and Redish 2020a). Accordingly, we recorded field potentials from the mPFC during our set-shifting task to assess whether activity varied with respect to choice outcome, VTE, learning phase, and flexibility score.
Our results show that learning, behavioral flexibility, VTE, and choice outcomes are typically tightly coupled to one another but can decouple depending on context. Increases in choice accuracy, VTE rates, and flexibility scores aligned to identified learning points. In support of the often-claimed role for VTE in deliberation, VTE trials were more likely to end in correct choices, and correct VTE trials were more likely to have a higher flexibility score. However, VTE on trials during low-flexibility periods were more likely to lead to errors, and incorrect VTE trials were more likely to have lower flexibility scores, suggesting that VTE may sometimes be a marker of uncertainty, not deliberation.
Additionally, both observable and latent behavioral measures were associated with changes to power distributions in different mPFC field potential frequency bands. Specifically, trials with VTE showed elevated theta and beta compared to non-VTE trials, and periods when learned strategies could be exploited after learning were associated with stronger gamma. Taken together, these results suggest that the confluence of these behavioral measures can be used to delineate behavioral contexts, as exemplified by our demonstration that VTEs can be separated as either deliberative or uncertain. Moreover, we strengthen our behavioral findings by showing variations in mPFC activity that track both observable and latent behavioral measures. Overall, these results help link learning, behavioral flexibility, variations in decision-making behaviors, and changes in mPFC physiology through mutually corroborative evidence.
Results
We used a spatial set-shifting task (Fig. 1A) that required rats to either continually return to the same location (use a place rule) or alternate between locations on successive trials (use an alternation rule). This design is similar to Meyer-Mueller et al. (2020), except we use a plus maze instead of a T-maze, with pseudo-randomly chosen start arms to ensure that only strictly allocentric, place strategies (as opposed to egocentric, body-turn strategies) will be successful. Because prior results show differences in VTE rates for egocentric compared to allocentric navigation (Schmidt et al. 2013), but no consistent changes during switches between different egocentric strategies (Meyer-Mueller et al. 2020), we analyzed whether there were performance differences in (allocentric) place compared to (allocentric) alternation strategies.
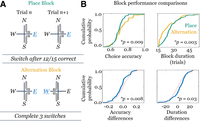
Performance differs according to task rule. (A) Diagram of task rules. Place blocks (top) reward continual visits to a particular (E or W) arm, and alternation blocks (bottom) reward alternation between E and W arms on successive trials. Sessions consist of three block switches. Switches occurred when 12 of the previous 15 choices were consistent with the target rule. (B) Multiple measures of performance are better for alternation blocks compared to place blocks. Unpaired cumulative distributions for choice accuracy within a block are leftward shifted for place blocks (top left, green line), whereas alternation block durations are leftward shifted (top right, gold line). P-values are calculated using unpaired, two-sample, two-sided T-tests. Within the session, paired comparisons suggest the same conclusion (bottom). Differences between choice accuracy in adjacent place and alternation blocks (bottom left, solid blue line, place minus alternation) are shifted to the left of zero, whereas differences in block duration are shifted to the right of zero (bottom right, solid blue line, place minus alternation). P-values are calculated using signed-rank tests. Red dashed lines are zero-mean (left) or median (right) standard deviation-matched, normal cumulative distributions for comparison.
Choice accuracy distributions for place blocks had a lower mean compared to alternation blocks (Fig. 1B, top left; two-sample, two-tailed T-test, with t = −2.70, df = 158,  = 72%,
  = 69%, P = 0.009, d = −0.42; overbars represent the sample mean). Block duration distributions were nonnormally distributed for alternation trials,
which showed cumulative probability bunched around the lower block duration limit (15 trials). Alternation blocks tended to
take fewer trials to complete than place blocks (Fig. 1B, top right; two-sample, two-tailed Wilcoxon rank-sum test, with Z = −2.94, n = 160, altm = 23.3, placem = 25.8, where subscript m denotes median, P = 0.003, d = −0.3). Within-session comparison of the adjacent pairs of place and alternation blocks (Fig. 1B, bottom) led to the same conclusions—namely, that place blocks were lower accuracy than adjacent alternation blocks (Wilcoxon
signed-rank test, Z = −2.65, n = 80, Δaccm = 2.7%, P = 0.008, d = 0.30) and took longer to complete (Wilcoxon signed-rank test, Z = −2.27, n = 80, Δdurm = 5, P = 0.02, d = 0.21). Although these differences are consistent, note that they are not large (∼3% median accuracy difference and approximately
five trial median duration difference; Cohen's d absolute values below 0.5).
= 69%, P = 0.009, d = −0.42; overbars represent the sample mean). Block duration distributions were nonnormally distributed for alternation trials,
which showed cumulative probability bunched around the lower block duration limit (15 trials). Alternation blocks tended to
take fewer trials to complete than place blocks (Fig. 1B, top right; two-sample, two-tailed Wilcoxon rank-sum test, with Z = −2.94, n = 160, altm = 23.3, placem = 25.8, where subscript m denotes median, P = 0.003, d = −0.3). Within-session comparison of the adjacent pairs of place and alternation blocks (Fig. 1B, bottom) led to the same conclusions—namely, that place blocks were lower accuracy than adjacent alternation blocks (Wilcoxon
signed-rank test, Z = −2.65, n = 80, Δaccm = 2.7%, P = 0.008, d = 0.30) and took longer to complete (Wilcoxon signed-rank test, Z = −2.27, n = 80, Δdurm = 5, P = 0.02, d = 0.21). Although these differences are consistent, note that they are not large (∼3% median accuracy difference and approximately
five trial median duration difference; Cohen's d absolute values below 0.5).
We implemented a previously developed algorithm that uses recency-weighted Bayesian inference to identify changes in strategy learning (Maggi et al. 2024). Strategy likelihoods are independently computed by comparing the rat's observed decision history to a model of what a perfect decision-maker would do if it were using a particular strategy. Updating the Bayesian models with each trial's decision generates a new likelihood estimate for all strategy models, which produces trial-by-trial time series of strategy likelihoods (colored lines in Fig. 2A). Because we know what strategy ought to be used, we operationalize the learning point as the trial when the most likely strategy (estimated using the Bayesian modeling approach) matches the target strategy for the remainder of that target strategy block (dotted vertical lines in Fig. 2A). Conceptually, we regard the learning point as splitting a block into a prelearning point exploratory period, in which different strategies are tested, and an exploitation period, in which memory can be used to guide decision-making.
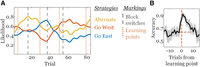
Identifying learning points from strategy likelihoods. (A) We modeled three strategies—go east (blue), go west (orange), and alternate (yellow). Learning points are indicated with vertical, orange, and dotted lines and block switches are indicated by vertical, gray, and dashed lines. The average choice accuracy aligned to learning points is shown in B. (B) A shaded 95% confidence interval surrounds the average. The horizontal dashed line indicates the prelearning point average, and the vertical dashed line indicates the learning point.
Because the learning point was identified without explicit reference to choice outcomes, seeing increases in the likelihood of a correct choice with respect to the putative learning point would corroborate that it had been correctly identified. As expected, average choice accuracy aligned to learning points showed a striking increase just before the learning point, remaining elevated for several trials after. As shown in Figure 2B, the average choice accuracy (dashed horizontal line) for the 15 trials before the learning point (dashed vertical line) is 63.4% (dashed horizontal line), and the lower bound of an estimated 95% confidence interval exceeds that value starting one trial before the learning point, peaks one trial after the learning point, and remains above the prelearning point average for seven trials after the learning point (data shown for n = 40 sessions, in which each point within 15 trials on either side of the learning point is the average choice accuracy across the four within-session blocks; note that we see the same result using n = 13 subjects with averages across 4–24 within-subject blocks).
As mentioned, prior reports show VTE rate differences for different types of strategy (Schmidt et al. 2013). In our task, both strategies had right-skewed, overlapping probability distributions of VTE rates (Fig. 3A, top right; two-sample, two-tailed Wilcoxon rank-sum test, Z = 0.36, altm = 15%, placem = 14%, P = 0.72, d = 0.03). Other studies suggest that the relationship between VTE and choice outcome is, if nothing else, task-dependent,
so we calculated the within-session difference between the number of VTE trials with correct and incorrect choices. For this
task, VTE was far more likely on correct choice trials. In fact, there were only four sessions (10%) in which VTE led to errors
more often than correct choices, and out of those four, VTE was far more likely to precede errors in only one (Fig. 3B; t = 5.04, df = 39,  = 8.8, P < 0.001, d = 0.80; gold lines denote sessions with at least as many VTEs leading to errors).
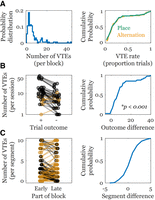
Summary of VTEs by session and block. (A) The left histogram shows the number of VTE trials per block, whereas the right shows the proportions of VTEs per block. The right histograms show no differences in how proportions of VTE per block are distributed for either place (green) or alternation (gold) blocks. (B) Within-session differences in VTE on correct compared to incorrect choices show that VTE was far more likely to lead to a correct choice. Raw numbers are shown on the left (using a log y-axis), and the distribution of within-session differences is on the right. (C) Although VTE was more likely to lead to correct choices, there were no differences in the probabilities of VTEs occurring early compared to late in blocks. Gold lines in B and C indicate instances in which a value on the right was higher than its paired value on the left.
The current and historical literature do not seem to have come to a consensus on how VTE should unfold throughout the course
of learning. Some report that VTE in navigation or location-based tasks decrease over time as learning occurs (Jackson 1943; Kemble and Beckman 1970) in a task-dependent manner (Goss and Wischner 1956), but in other tasks VTE has been shown to stay elevated throughout, supposedly depending on the task difficulty (Gentry 1930; Tolman 1948). Our task ensures that the current contingency has been learned at the end of a block but is unknown at the beginning of
a block. Thus, we asked if there were differences in the number of VTE trials in the first 10 trials of a block compared to
the last 10. We saw that there were no differences in the number of early- or late-block VTE trials (Fig. 3C; t = −0.43,  = −0.05, P = 0.67, d = −0.03; gold lines denote blocks with at least as many VTEs later in the block).
Because VTE has been suggested to track task learning and has been proposed as a behavioral marker for deliberation, we looked at whether changes in VTE rates aligned to learning points (Fig. 4A). Indeed, Figure 4C shows that there are significantly elevated VTE rates from three trials before to one trial after the learning point (see Materials and Methods for estimation of VTE rates and statistical analysis paradigm), further validating the association between learning and VTE without appealing to choice accuracy. Trials 9–15 after the learning point, on the other hand, show consistently below average VTE rates. These learning point–related changes in VTE rates contrast with VTE rates aligned to block switches, which hover around the average for almost the entire window (Fig. 4B).
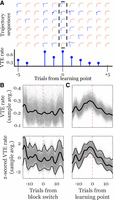
VTE rate changes align with learning points. Each row in A shows trajectories from sequences of trials aligned to estimated learning points (dashed rectangle/trial zero on the bottom axis) for a given block. Blue trajectories have been identified as VTEs and orange trajectories have been identified as non-VTEs. The stem plot shows VTE rates for this sample of six sequences. Note the general increased rate for trials near the learning point. The top panels in B and C show changes in VTE rate with respect to block switches on the left and estimated learning points on the right (dashed, vertical, red lines). For all plots, bold black lines are the averages of 1000 iterations of a hierarchical bootstrap to estimate VTE rate time series from binary vectors; light gray lines are the individual iteration results. The top panels show raw rates and the bottom plots show z-scored rates. Dashed, horizontal, and red lines in the lower plots show the mean for comparison (obscured by individual iteration results in B). Dotted black lines show the 2.5 and 97.5 percentiles of the distribution.
Changes in strategy likelihoods suggest updates in choice behavior, allowing us to define a behavioral flexibility measure based on trial-by-trial strategy likelihood changes (Fig. 5A). Importantly, this method allowed us to measure behavioral flexibility without reference to the choice outcome, which could mask instances in which subjects did switch their strategy, but to one that did not match the target rule. Further, it allowed us to assess flexibility trial-by-trial instead of over periods of trials. Much like choice accuracy and VTE rate dynamics, aligning sequences of flexibility scores to the learning points showed that there were consistent increases in flexibility starting just before the learning point that end several trials after (Fig. 5B). Note that although learning points and flexibility scores are defined by strategy likelihoods, flexibility scores can and do vary—sometimes dramatically—away from the learning point. Likewise, sometimes flexibility scores were lower during learning points when transitions happened slowly. Thus, this result was expected, but not guaranteed.
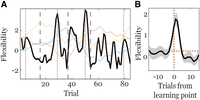
Flexibility score example and relation to learning point. (A) Bold black line indicates flexibility scores for one example session (same as Fig. 2A, shown in the background). Learning points are indicated with vertical, orange, and dotted lines, and block switches are indicated by vertical, gray, and dashed lines. The average flexibility score aligned to learning points is shown in B. A shaded 95% confidence interval surrounds the average. The horizontal dashed line shows the prelearning point average, and the vertical dashed line shows the learning point.
The associations between VTE rates, flexibility dynamics, and choice accuracy changes provide strong support for the claim
that VTE can serve as a marker for deliberation. However, not all VTE occurred around learning points; some VTE occurred during
periods of low flexibility, and some VTE led to errors. Thus, we asked whether there may have been another, nondeliberative
type of VTE. We know that VTE near learning points happens as choice accuracy and flexibility are high, but to see if opposing
relationships existed as well, we asked if incorrect VTEs were associated with lower flexibility scores, and if VTEs that
happened in inflexible periods were more likely to be incorrect. Indeed, incorrect VTEs had significantly lower flexibility
scores (Fig. 6A; t = 9.40,  = 0.60,
  = −0.32, P < 0.0001, d = 0.57). We defined a set of criteria that determined whether a VTE occurred during a flexible or inflexible period. First,
any trial within two trials of a learning point was considered flexible (regardless of flexibility score). Second, a trial
had to be more than three trials before the end of a block (unless it was within two trials from the learning point). Third,
any trial with a flexibility score in the top 60th percentile was considered flexible (unless it was within three trials from
a block switch). Similarly, inflexible periods could not be within two trials of the learning point (regardless of flexibility
score) and had to have flexibility scores in the bottom 40th percentile (see Materials and Methods for further descriptions).
Within-session paired comparisons showed that choice accuracy was significantly higher during flexible learning-related VTE
than VTE during inflexible periods that did not border the learning point (Fig. 6B; t = 5.23,
= −0.32, P < 0.0001, d = 0.57). We defined a set of criteria that determined whether a VTE occurred during a flexible or inflexible period. First,
any trial within two trials of a learning point was considered flexible (regardless of flexibility score). Second, a trial
had to be more than three trials before the end of a block (unless it was within two trials from the learning point). Third,
any trial with a flexibility score in the top 60th percentile was considered flexible (unless it was within three trials from
a block switch). Similarly, inflexible periods could not be within two trials of the learning point (regardless of flexibility
score) and had to have flexibility scores in the bottom 40th percentile (see Materials and Methods for further descriptions).
Within-session paired comparisons showed that choice accuracy was significantly higher during flexible learning-related VTE
than VTE during inflexible periods that did not border the learning point (Fig. 6B; t = 5.23,  = 23.5%, P < 0.0001, d = 1.01). Together, these data suggest that VTE can happen in at least two contexts—one that suggests a deliberative process,
and another which suggests uncertainty or indecision.
= 23.5%, P < 0.0001, d = 1.01). Together, these data suggest that VTE can happen in at least two contexts—one that suggests a deliberative process,
and another which suggests uncertainty or indecision.
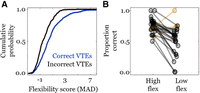
Evidence for multiple VTE types. (A) Correct VTEs are more likely to have higher flexibility scores than incorrect VTEs. (B) VTE trials in the top 40th percentile of flexibility scores are more likely to be correct than VTE trials in the bottom 40th percentile.
The mPFC has been repeatedly implicated in strategy switching tasks and tasks that require spatial working memory. As such, we recorded mPFC field potential rhythms from a subset of rats used in the behavioral data set (n = 3) to see if mPFC rhythms tracked any aspects of behavioral context formation that we were able to define (see Fig. 7 for approximate recording locations and field potential examples). We examined three mPFC rhythms, each suggested to have a role in linking cognition to behavior in rodents: (1) the theta rhythm (6–12 Hz), which tends to synchronize with hippocampal theta when spatial working memory is taxed (Jones and Wilson 2005; Benchenane et al. 2010; Hyman et al. 2010; Hallock et al. 2016; Negrón-Oyarzo et al. 2018; Tavares and Tort 2022; de Mooij-van Malsen et al. 2023; Stout et al. 2023); (2) the beta rhythm (15–30 Hz), which tends to be present during decision-making (Symanski et al. 2022; de Mooij-van Malsen et al. 2023; Jayachandran et al. 2023); and (3) the gamma rhythm (40–100 Hz), which has been associated with working memory, learning, and sensory information processing (Negrón-Oyarzo et al. 2018; Cansler et al. 2022; de Mooij-van Malsen et al. 2023).
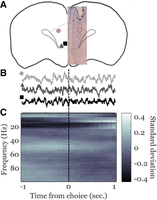
Histological placement and LFP examples. (A) Recording sites were spread throughout the prelimbic cortex. Different shapes denote tip locations for the three different animals in the data set. Sites span approximately +3.7 to +4.3 mm anterior to bregma. (B) LFP examples from each of the three recording sites, marked by corresponding shapes and shades from A. Each recording is aligned so the center of the trace is when the rat crosses the center of the maze platform, with 1 sec before and 1 sec after on either side. (C) Average spectrogram of all LFPs from across choices. Each trial's spectrogram is mean-subtracted and scaled by the standard deviation, across time, for every frequency.
As shown in Figure 7A, the three recording sites we analyzed were located in the anterior prelimbic cortex (see Electrophysiology subsection of Materials and Methods for approximate coordinates). Field potentials were aligned to decision points (Fig. 7B), converted into time–frequency representations, and normalized by trial across a 6 sec window containing 3 sec before and 3 sec after the decision point (average across all trials shown in Fig. 7C). On average, most of the variance in the spectrogram appears distributed within the a priori defined frequency bands described above.
We tested whether mPFC field potential rhythms were related to any of the measurements used to define behavioral context by comparing rhythms on trials with opposing contextual components. There were four main components used to delineate behavioral contexts: choice outcome, VTE occurrence, flexibility magnitude, and learning phase. To make paired within-session comparisons, we used a similar hierarchical bootstrap sampling technique used to generate VTE rate curves. First, subjects were sampled, then, for each subject, a random sample of sessions was drawn, and, within each session, we computed the mean difference in the strength of rhythmic activity for the different frequency bands on opposing trial types (i.e., correct minus incorrect, VTE minus non-VTE, exploit period minus explore period, and high flexibility minus low flexibility). We refer to the first element in the pair (e.g., correct trials) as the condition trial and its opposite (e.g., incorrect trials) as the comparison trial. Repeatedly sampling in this way produces a posterior distribution of differences. We assume that if there were no difference between condition and comparison trials, distributions should be centered at zero with a roughly even proportion of the data on either side of the mean. As such, we quantified the strength of evidence for a particular rhythm varying with respect to a given contextual component by the probability that its distribution sat above zero. If none of the data for a given distribution was above zero, the probability value (P) would be zero, and this would be very strong evidence that those condition trials had weaker activity than their accompanying comparison trials in that frequency band. At the other extreme, if all of the distribution was above zero, this would be a probability value of 1, and strong evidence that the condition had stronger rhythmic activity in that band than the comparison.
Results for different opposing trial combinations, separated by rhythm, are shown in Figure 8. Shades of the distributions vary such that darker shades indicate stronger evidence that condition trials have weaker rhythms than comparison trials for trial type, whereas lighter shades indicate stronger evidence of that rhythm's presence on condition trials than comparison trials. An additional measure, analogous to Cohen's D for one sample distribution, is reported in the upper corner for each distribution. The value's magnitude measures how many standard deviations the distribution's mean is from zero, and its sign tells in which direction. The first row, comparing correct and incorrect trials, shows that both theta and gamma distributions are close to zero, with little indication that trial types differ. Gamma, however, appears to be more consistently weaker on correct trials (Fig. 8A; gamma, P = 0.21, d = −0.84). Interestingly, all rhythms tend to have stronger increases during VTE trials, with very strong evidence for beta (Fig. 8B; beta, P = 0.98, d = 2.36) and strong evidence for theta (Fig. 8B; theta, P = 0.93, d = 1.49) on VTE trials. Only gamma appears to show any difference in the postlearning exploit period compared to the explore period, with strong evidence for higher gamma during the exploit period (Fig. 8C; gamma, P = 0.95, d = 1.62). Comparing high- and low-flexibility trials shows weak evidence that theta may be higher on high-flexibility trials, whereas gamma tends to be weaker on high-flexibility trials (Fig. 8D; gamma, P = 0.18, d = −0.85).
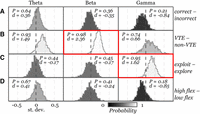
mPFC rhythms vary based on contextual components. Each box in the grid shows the distribution of differences for hierarchically sampled trial comparisons. The type of trial comparison is shown on the right side of the figure, outside the grid of distributions. The left column shows comparisons for the theta rhythm, the middle for the beta rhythm, and the right for the gamma rhythm. The probability of the distribution falling above zero is indicated by P in one of the upper corners of each plot, and one sample analog to Cohen's D is indicated by d underneath. Each distribution is shaded according to its Probability value, as shown by the gradient below the grid. Distributions outlined in red have P ≥ 0.95 and d ≥ 1.5 and are considered to represent strong evidence for a difference between groups. (A) There are no clear differences in the strength of any rhythm for correct compared to incorrect trials. (B) VTE trials have stronger beta activity than non-VTE trials. (C) Exploit trials have stronger gamma activity than explore trials. (D) There are no clear differences in the strength of any rhythm on high-flexibility trials compared to low-flexibility trials.
Discussion
Behavioral flexibility is a complex phenomenon that could manifest in many different ways, but our typical understanding of it primarily focuses on a single measure—choice outcome. VTE behavior has been documented for nearly a century, but it has been difficult to reconcile descriptions of its function. This study sought to supplement our understanding of behavioral flexibility and fill in some of the gaps in the VTE literature by analyzing VTE with respect to other streams of behavioral data that also occurred on a trial-by-trial basis during a dynamic decision-making task. To do so, we estimated strategy likelihoods from rule-based models, which enabled learning point identification, and developed a behavioral flexibility measure based on changes in strategy likelihood estimates. We show that choice accuracy, VTEs, and flexibility scores all increased surrounding learning points. Further, we show that VTEs were far more likely to be correct than incorrect in this task, and that correct VTEs were more likely to occur on trials with higher flexibility scores, suggesting a typical role in deliberation. However, we also found VTEs that occurred during periods of low flexibility and were often wrong, indicating that VTE may sometimes reflect uncertainty instead of deliberation. Finally, we showed that these behavioral measures often had distinctive relationships to mPFC field potential activity. In particular, we see stronger increases in mPFC beta power on trials with VTE compared to non-VTE trials, and we see stronger gamma power during choices in the postlearning point exploitation period compared to the prelearning point exploration period. Covariations between mPFC activity and specific behavioral measures provide further validation that our analyses effectively partitioned behavior into relevant naturalistic epochs.
As mentioned, VTE-like behaviors are present in humans (Voss and Cohen 2017; Santos-Pata and Verschure 2018; Iggena et al. 2023), while inflexible perseverative behavior and difficulty with executive control are common measures in clinical diagnoses of neurological disorders (Uddin 2021). Because any behavior that can be identified and modeled based on decision-making is amenable to the analysis workflow we have used, and many decision-making tasks require some active trajectory toward a decision, we hope that the framework described here will be of general interest to behavioral neuroscientists asking both basic and clinical questions.
Expanding analyses of behavioral flexibility
Based on the simple premise that behavioral flexibility manifests as changes in strategy use, we were able to score flexibility on a trial-by-trial basis and track its changes with respect to task dynamics. We verified that these scores did indeed track flexibility by showing their strong alignment with putative learning points, increases in choice accuracy, and peaks in VTE rate, which have also been proposed as a marker of flexible, deliberative behavior. Having a continuous scale that enables trial-by-trial identification of high and low flexibility based on statistically derived cutoffs can be useful for providing additional context to other behavioral measures, as we show in Figure 6. In our case, extra context about flexibility showed that VTE on low-flexibility trials was likely to result in errors. By putting these facts together, we concluded that VTE resulting in an error on low-flexibility trials was likely to represent uncertainty about the decision, which differs from the typical interpretation of VTE as a deliberative behavior.
Another benefit of having flexibility scores that do not depend on choice outcome is the ability to identify periods of high flexibility but low choice accuracy. This occurs, for example, when a subject switches from a prior strategy to a new strategy that does not match the target. In our task, this would happen if the prior strategy was go east and the current strategy is go west, but a subject started alternating instead of switching immediately to go west. Identifying these periods could prove particularly useful for trying to disentangle learning, reward processing, or attention from flexibility. Increased flexibility after block switches but longer exploration periods, for example, could indicate that flexibility is not affected directly, but something about the subjects’ ability to stabilize behavior is impaired. On the other hand, unaffected exploration periods coupled with long exploitation periods could indicate that the subjects struggle to effectively use newly learned strategies or are too quick to abandon them. Both of these are distinct from a situation in which flexibility remained low after block switches because of the continual elevated likelihood of a prior strategy, which would indicate perseveration of the prior strategy.
Although our analysis of mPFC activity did not reveal strong changes in rhythmic activity as a function of flexibility, it did suggest that gamma rhythms may be slightly weaker in the high-flexibility state (Fig. 8D, right column). Interestingly, when combined with our other observations about mPFC rhythms, we might expect incorrect, inflexible trials during the exploitation period to have some of the strongest gamma activity. These are trials in which a rat chose incorrectly despite a recent history of correct responses. Importantly, because we have shown that the learning phase and gamma strength are related, we might expect a similar choice history pattern during the exploration period to have weaker gamma band activity. These distinctions highlight the utility of contextualizing behavior when interpreting neural data.
Reconciling VTE findings and contextualizing behavior
There are several hypotheses about what VTE is and why it happens. Most of the initial reports claimed that VTE tended to happen just before or as rats learned a task (Tolman 1926; Gentry 1930; Muenzinger and Gentry 1931; Muenzinger 1938). Muenzinger (1938) and Gentry (1930) noted that, although they had assumed the pause-and-reorient behavior we now call VTE would primarily reflect active sampling of sensory stimuli, rats still showed VTE when sensory environments were the same and thus not useful in determining where to go for reward. This suggested that the behavior was not simply used to compare sensory information but may instead indicate comparison of past and present experience. Additionally, rats continued to VTE throughout their learning and training during difficult tasks, but they would typically stop after they had learned to consistently make simple sensory discriminations, often interpreted as having formed a habit (Gentry 1930; Muenzinger 1938; Tolman 1948).
In the context of more recent experiments, the repeated observations that VTE tends to occur just after new reward contingency or rule switch and decrease farther into blocks (Blumenthal et al. 2011; Meyer-Mueller et al. 2020; Kidder et al. 2024) are in accordance with the early observations that VTE is linked to learning. The majority of modern research treats VTE as a marker of deliberation, but inconsistency in how VTE relates to choice outcome (Schmidt et al. 2013; Meyer-Mueller et al. 2020; Kidder et al. 2021; George et al. 2023) suggests that what VTE represents or is used for may not have a unitary explanation (Goss and Wischner 1956). This possibility was reported in Gentry (1930), who showed that some rats seemed to VTE consistently while never learning proficiently, whereas others performed exceptionally well, but did not exhibit the typical decline in VTE rates. Gentry's characterization was that VTE consistently associated with poor performance could indicate never having truly learned the task, whereas VTE during high performance marked continued deliberation. Tolman similarly claimed that VTE during difficult sensory discriminations may persist because comparison and indecision persist, whereas its increase during initial learning on easy sensory discriminations is because rats concurrently learned which sensory stimuli (visual/auditory) to associate with reward, as well as the discriminative reward contingency (black vs. white, toward tone vs. away from tone) itself (Tolman 1948).
Separating VTE into subtypes based on context may help explain some of the idiosyncrasies in how different studies have reported on and conceptualized VTE. For example, silencing the nucleus reuniens has been shown to increase VTE during inflexible periods of perseverative responding, leading to incorrect choices (Stout et al. 2022). In our framework, we would interpret VTE in this context as indicative of uncertainty instead of deliberation. Similarly, Schmidt et al. (2013) reported that VTE typically led to an error and was most likely on difficult trials—in other words, during times when uncertainty was likely high. However, they also reported VTE during periods of high task proficiency and after errors, times when animals could deliberate based on prior experience and understanding. These situations and our demonstration that VTE could be separated based on choice outcome and flexibility score suggest that future work should take steps to determine whether VTE is more likely to reflect uncertainty or indecision than deliberation. Furthermore, our results caution that VTE in and of itself should not be considered a marker of behavioral flexibility, even if there are times when it may well be.
Neural manipulations and VTE
Several mPFC (Schmidt et al. 2019; Kidder et al. 2021, 2024; McLaughlin and Redish 2023) and hippocampus (Hu and Amsel 1995; Blumenthal et al. 2011; Bett et al. 2012, 2015; Meyer-Mueller et al. 2020) manipulation studies seem to agree that disrupting these regions is unlikely to increase VTE rates. Curiously, manipulating structures that connect these regions (e.g., the amygdala, perirhinal cortex, and nucleus reuniens) does increase VTE (Kemble and Beckman 1970; Kreher et al. 2019; Stout et al. 2022). One hypothesis for why this may be is that both the hippocampus and mPFC are specifically involved in enabling deliberative VTE behavior. When one of these structures is not functioning as usual, the deliberation process may fail altogether. Mechanistically, it may be that sequential hippocampal activity generates an array of possible options (Johnson and Redish 2007; Kay et al. 2020) whereas the mPFC evaluates those options before choices (Redish 2016; Schmidt et al. 2019; Zielinski et al. 2019; Hasz and Redish 2020b; Tang et al. 2021). If either the representation of possibilities in the hippocampus or the evaluative process in the mPFC fails to occur, VTE may become less likely to happen. In contrast, if both processes proceed as they normally would locally but are unable to coordinate correctly because of interruptions in connecting circuitry, VTE may be just as likely—if not more likely to occur—but related to uncertainty instead of deliberation.
Neural activity in the mPFC
Intriguingly, not only are our behavioral measures self-consistent and useful for defining latent behavioral contexts, they are also consistent with neural measures of mPFC activity. Our analysis of mPFC field potentials shows that different contextual components are associated with different activity states. The primary goal of these analyses was to provide further validation for our methods of parceling behavior and the measurements we used. Nevertheless, our results provide some insights into how mPFC rhythms reorganize with respect to behavior. As an example, two of the strongest relationships we see are higher mPFC theta and beta on VTE trials compared to non-VTE trials (Fig. 8, second row, left and middle columns). This is in line with results showing hippocampal activity changes during VTE (Johnson and Redish 2007; Papale et al. 2016; Amemiya and Redish 2018; Schmidt et al. 2019; Miles et al. 2021) and the evidence for hippocampal–prefrontal interactions during VTE (Schmidt et al. 2019; Hasz and Redish 2020b; Stout et al. 2022). The beta rhythm, specifically, has recently been shown to synchronize the mPFC and hippocampus via brief activity bursts in the nucleus reuniens during an odor sequence memory task (Jayachandran et al. 2023), and our result provides further evidence that beta-rhythmic activity in the mPFC component of this tripartite circuit is crucial for memory-guided decision-making.
Much like VTE is an observable binary event—we can see whether it happens or does not—trials can either be correct or not. Despite the strong evidence for broad spectral changes in the mPFC on VTE trials compared to non-VTE trials, we do not see particularly strong evidence of differences in any band based on trial outcome. There is perhaps some hint that gamma is weaker on correct compared to incorrect trials, but it could be that latent factors play a larger role in modulating mPFC rhythms relative to choice accuracy.
The broadest latent context change we define—the shift from strategy exploration to exploitation after the learning point—is more clearly accompanied by changes in gamma rhythms (Fig. 8, third row, right column). This is in line with prior work in rodents showing that prefrontal explore–exploit relationships are impaired if the mPFC is inactivated (Ragozzino et al. 1999, 2003; Birrell and Brown 2000; Laskowski et al. 2016), as well as studies of mPFC units in rats showing that both individual units (Jung et al. 1998; Rich and Shapiro 2009) and population level encodings (Guise and Shapiro 2017; Malagon-Vina et al. 2018; Hasz and Redish 2020a; Maggi and Humphries 2022) track strategy switches. An alternative explanation could be that subjects were more likely to be correct during exploitation periods, and gamma during choices was related to expected choice outcome. If this were the case, we would expect to see the same pattern of increased gamma-rhythmic activity on correct compared to incorrect choices, but, as mentioned, we see a trend in the opposite direction (Fig. 8, first row, right column). This suggests that it is not the expected outcome driving the difference in gamma fluctuations during explore and exploit trials. In support of these observations, recent work in humans with intracranial EEG electrodes in the mPFC has shown that there are changes in gamma band activity during the transition between exploration and exploitation (Domenech et al. 2020).
Another latent context measure is flexibility magnitude, which, according to our data, may also be associated with changes in the gamma rhythm (Fig. 8, fourth row, right column). When split into high- and low-flexibility trials, gamma has a very similar distribution to gamma differences related to trial outcome. These two measures could very well be related, as both flexibility and choice accuracy peak around learning points, but there is not as clear a relationship between flexibility and learning phase. Flexibility can be quite variable during exploration as different strategies are tested (e.g., around trials 40 and 60 in Fig. 5A), and flexibility also typically transitions quickly from high at the beginning of the exploit period to low within several trials (Fig. 5B). Although all of these measures likely have some individual relationship to gamma, it is also likely that those relationships are not independent of one another, and it remains to be seen how they covary. Still, our results suggest that both latent and explicit behavioral measures appear to have distinct associations with gamma in the prefrontal cortex.
Conclusion
This study characterized learning, decision-making behaviors, and mPFC activity during a spatial set-shifting task. By quantifying changes in strategy use, we proposed a new way of calculating behavioral flexibility and show that flexibility scores aligned with increases in decision-making accuracy and VTE rates that accompanied learning. At other times, relationships between these patterns broke down. Examining trials with atypical behavioral patterns enabled reinterpretation of similar looking behaviors as cognitively distinct. Finally, we showed that these measures, particularly VTE and learning phase, show characteristic relationships to mPFC rhythms—namely, that mPFC beta power increases on trials with VTE and gamma power is stronger on trials in the postlearning exploitation period.
Materials and Methods
Subjects, apparatus, training protocol, and behavioral task
Food restricted (85% of body weight) Long–Evans rats (n = 13, 7 female; Charles River Laboratories) on an ad libitum water schedule were trained to perform a spatial set-shifting task. All rats were between 6 and 12 months old during training, and were housed singly in a temperature- and humidity-controlled facility with a 12 h light–dark cycle. All care and procedures were done in compliance with the University of Washington Institutional Animal Care and Use Committee under National Institute of Health guidelines.
Sessions were run on an elevated plus maze (black Plexiglas arms, 58 cm long × 5.5 cm wide, elevated 80 cm from floor), with movable arms and reward feeders controlled by custom LabView 2016 software (National Instruments) that tracked the rat and automatically raised and lowered arms based on positions recorded by a SONY USB web camera (Sony Corporation) acquiring frames at ∼35 Hz. Rats were initially habituated to handlers and the maze for however long it took them to comfortably interact with handlers, forage for pellets on the maze, and habituate to maze movement and noise (several days to 1 week).
Task training started with a forced choice paradigm, in which rats learned the trial structure, consisting of leaving its pseudo-randomly chosen “North” or “South” starting arm, then navigating to an “East” or “West” arm for a 45 mg sucrose pellet reward (TestDiet). Initially, rats completed five to seven trials that forced them to either alternate between reward sites or return repeatedly to the same East or West location, regardless of their starting point. This number was increased until rats could do 10 trials of each reward contingency in <45 min, at which point they were given a free-choice version of the same task. Reward contingencies sequences were randomly ordered for all training and testing days, with the exception that alternation blocks were not allowed to be consecutive. This artificially increased the number of sessions that started with an alternation block compared to what would be expected from truly random ordering, but all rats were exposed to multiple sessions throughout training and testing in which the first blocks were place blocks.
In the free-choice training version, we did not change start arms on error trials until rats made a certain number of correct choices, and initially started with a low choice accuracy criterion for switching between blocks (typically an ∼70% success rate in an eight to 10 trial window). As rats started completing all reward contingencies (alternate, go East, go West), we increased the criterion for success and minimum number of trials per block and decreased the number of correct trials needed before errors no longer influenced start arm switches. This procedure was tailored to each rat until it could complete four reward contingencies (two alternation blocks and two place blocks; one East, one West) in <150 trials, with start arms pseudo-randomly chosen for all trials. We also ensured that two alternation blocks did not occur back-to-back.
Testing sessions followed the same trial structure as the final training sessions. As mentioned above, start arms were “pseudo-random.” This was done to ensure that between 50% and 60% of trials within 15 trial stretches had start arm switches. Doing so increased the number of switches compared to what you would expect from random draws, while slightly decreasing the number of long (four to 10 trial) sequences in which the start arm stayed the same, and eliminating sequences without a switch that were longer than that. For this data set, all rats completed three switches, although not all completed the fourth block. A total of 40 sessions from 13 rats were analyzed with all but one rat contributing at least two sessions.
Position tracking and VTE identification
We identified VTEs in much the same way as Kidder et al. (2024). Briefly, we took the videos that tracked coarse body location during the task and used DeepLabCut (DLC) version 2.2 (Mathis et al. 2018; Nath et al. 2019) to identify the rats’ heads. We started with the same model trained in Kidder et al. (2024) and retrained a new iteration with additional labeled data from the set-shifting experiments. Each training attempt used NVIDIA GEFORCE GTX 1080 GPU with 500,000 iterations. Trajectories with VTE were detected by projecting the position data into principal component (PC) space and clustering the PC representations of the trajectories with hierarchical agglomerative clustering. Before projection, all trajectories were aligned and standardized to the same starting and ending positions and interpolated (or linearly subsampled, if necessary) to have the same number of points. Visual inspection of the clustering in PC space naturally formed two clouds in low-dimensional plots, and distance-based dendrograms cut to give two clusters separated trajectories with VTE from non-VTE trajectories, although with some errors (see examples in Fig. 4A).
To mitigate the errors, we reassigned certain trajectories initially not identified as VTE but with x-positions that crossed a certain threshold into the VTE category and used the combination of a low z-ln(idphi) measure (Blumenthal et al. 2011; Bett et al. 2012; Papale et al. 2012; Schmidt et al. 2013, 2019; Stout et al. 2022; McLaughlin and Redish 2023) and a failure to cross lower x-position boundary to reassign any VTEs that may have been mistakenly identified. Informal inspections of randomly sampled data subsets after classification suggest that this method is between 80% and 90% accurate, which is in line with supervised classification methods and near the threshold for interrater agreement (Miles et al. 2021).
Estimating strategy likelihoods, learning points, and flexibility scores
We adopted the procedure from Maggi et al. (2024) to estimate explicitly modeled strategy likelihoods, trial-by-trial, based on choice history and a recency-weighted decay factor to account for the inherent nonstationarity in behavior associated with strategy switching. Minor changes to strategy templates allowed us to model allocentric versions of the strategies instead of the egocentric versions originally used; we simply added a column to the data processing input that parsed “East” and “West” choices instead of “Left” and “Right” (though the algorithm can easily process both types of reference frame if both types of input are given). As in the original report, we used 0.9 as the parameter controlling the strength of the recency weighting. One addition we made was to add several randomly permuted trials to the beginning of sessions before processing with the algorithm. This dampened some of the algorithm's initial large swings in likelihood estimates that were due to limited trial history. Further, we smoothed likelihood time series with a five-trial Gaussian window to increase the reliability of learning point identification. As suggested in the original paper, we identified learning points as the trial when the target strategy became the most likely.
Our rationale for calculating flexibility scores from changes in strategy likelihood is based on the notion that decision-making patterns shifting to become consistent with a different strategy is the sign of flexible behavior in a set-shifting task. Thus, for each trial, the flexibility score is the absolute difference in strategy likelihoods from trial t − 1 to trial t, summed across strategies. For each session, this value is normalized by median absolute deviation (robust Z-score) because values tend to deviate more dramatically in the positive than negative direction, but the results remain the same when a normal, standard deviation–based Z-score is used.
Flexible periods, used for testing whether there were multiple VTE types, were defined based on three criteria. First, trials on either side of the learning point were automatically considered flexible, regardless of their flexibility score. Second, trials that were three trials before the end of a block were automatically not considered flexible, unless they were within one trial of the learning point. Third, any remaining trials in the top 60% of flexibility scores were considered flexible, whereas any in the bottom 40% of flexibility scores were not considered flexible. When analyzing choice accuracy on VTE trials during flexible compared to inflexible periods, we excluded sessions in which there were three or fewer trials of either type. Conclusions for this analysis did not change if we changed the ratios of flexible and inflexible VTEs that could be included (e.g., based the third criterion on median absolute deviations instead of percentiles), but this often changed the proportion of data we were able to use.
Statistical quantification
Critical values were set at 0.05. When sample sizes were large, and distributions looked approximately normal, two-tailed T-tests were used. If making within-session comparisons, one-sample tests of differences were done, comparing the empirical distribution to what would be expected for a distribution with zero mean. When distributions were strongly skewed, we performed two-tailed Wilcoxon rank-sum tests if the data were not paired, and two-tailed Wilcoxon signed-rank tests when they were paired. Learning point–aligned choice accuracy and flexibility score data were not subjected to formal statistical testing—instead, 95% confidence intervals were estimated as if they were from a normal distribution (using Z-values). These curves are presented as averages and confidence intervals across sessions (n = 40) but were nearly identical when comparing across subjects (n = 13).
Learning point–aligned VTE “rasters” and a peri-learn point VTE rate averages suggested that VTEs likely aligned to learning as well, so to test this we used hierarchical bootstrapping (Saravanan et al. 2020). This approach helped safeguard results from bias introduced by uneven data collection between subjects while also acknowledging that multiple measurements from individuals were not independent. It also allowed us to create rate distributions out of binary data. Subjects were sampled randomly with replacement enough times to match the total number of subjects in the data set (n = 13), and then, for each subject, a certain number of blocks was also randomly selected with replacement (eight for learning point– and six for block switch–aligned sequences of VTE data—equivalent to two sessions of data). Average VTE rates were calculated for these samples and smoothed with a five-trial Gaussian window across trials. Distributions were formed by repeating this procedure 1000 times. Significance was determined by asking which trials had at least 97.5% of their (Z-scored) iterations on either side of zero. Results were tested without smoothing, using larger smoothing windows, with different numbers of iterations, using median absolute deviations instead of standard deviation Z-scoring, using shorter and longer sequences of trials, and across many random seeds, all leading to the same conclusion. The only thing that sometimes changed was the number of trials surrounding the learning point that show significantly elevated VTE rates.
Electrophysiology procedures and analyses
A subset of the rats (n = 3, two female) had neural recordings from the mPFC. Recordings were collected from custom-built tetrode micro-drives with Intan headstages and Open-Ephys acquisition systems running at 30 kHz, as described in Kidder et al. (2021) and Miles et al. (2021). All mPFC recordings were localized to the prelimbic cortex (Fig. 7A), between ∼3.7 and 4.3 mm anterior to bregma. To protect sensitive components and reduce environmental electrical noise, micro-drives were secured in plastic tubes lined with aluminum foil. One ground wire connected the aluminum wrapped inner-shell with the EIB and, during surgery, another tied ground and reference wire was attached to a screw implanted over the cerebellum.
Recording windows for analysis were determined by finding the choice point, identified as the point closest to the center of the platform for each trajectory, and then extending 4 sec before and after that point. For each window, time–frequency spectrograms were calculated using Chronux's mtspecgramc function (Bokil et al. 2010), using a 2 sec window, 100 msec overlap, seven tapers, and a bandpass window of 0.5–100 Hz, generating a time–frequency matrix for each decision. After converting power values to decibels, we Z-scored each frequency component along the time dimension for each trial to normalize the data (see Fig. 7C to see the average representation of this matrix). Because we were working with a priori frequency bands and were only interested in decision-based activity, we averaged activity across each frequency band from −1 sec before to 1 sec after the decision point, meaning each trial gave average values for theta, beta, and gamma band activity.
We analyzed field potential activity in relation to different behavioral measures by creating hierarchically sampled bootstrap distributions (Saravanan et al. 2020) for specified pairs of conditions (Fig. 8). Each measure had a reference trial type, which we called the condition trial, and an opposing trial type called the comparison trial. For example, trials could either be correct (a condition trial) or incorrect (a comparison trial). This allowed us to perform within-session paired comparisons for each pair by subtracting the activity averaged across all sampled trials in the comparison group from the condition group. For each hierarchical sample, we used three individuals, four sessions, and 40 trials from each group (condition and comparison), all sampled with replacement. Thus, each difference is the average of activity from the 40 trials from the condition group minus the average activity of the 40 trials from the comparison group, and a member of the overall distribution is the mean of these differences across the 12 sessions drawn for that sample iteration. This was repeated 1000 times to generate the distributions shown in Figure 8. These distributions were treated as significant if 95% of their probability density was on either side of zero. However, as mentioned in Saravanan et al. (2020), the proportion of the bootstrap distribution on either side of a null value (zero, in our case) provides a relative measure of support for the hypothesis being tested. If the distribution is evenly split around the null value (i.e., P is ∼0.5), then the null hypothesis is supported, but if all of the probability density is above or below the null value (i.e., P = 1 or P = 0, respectively), then the experimental hypothesis is strongly supported, whereas intermediate values (e.g., P = 0.2 or P = 0.8) suggest some, although perhaps weaker, support (Saravanan et al. 2020).
Competing interest statement
The authors declare no competing interests.
Acknowledgments
We thank Arman Khan and Trinity Charles for their help with training, data collection, and troubleshooting the paradigm, and Dr. David Gire, Dr. Kevan Kidder, Victoria Hones, and Maeve Bottoms for helpful comments throughout the study. This research was supported by the National Institute of Mental Health research grant MH119391 to S.J.Y.M.
Author contributions: J.T.M. implemented the paradigm, collected data, performed formal analyses, wrote/adapted software, and wrote the original draft of the manuscript; G.L.M. collected data and helped design and troubleshoot the paradigm; and S.J.Y.M. supervised the project, acquired funding, and contributed revisions to the manuscript. All authors approved the final manuscript.
Footnotes
-
Article is online at http://www.learnmem.org/cgi/doi/10.1101/lm.053911.123.
- Received December 19, 2023.
- Accepted May 14, 2024.
This article is distributed exclusively by Cold Spring Harbor Laboratory Press for the first 12 months after the full-issue publication date (see http://learnmem.cshlp.org/site/misc/terms.xhtml). After 12 months, it is available under a Creative Commons License (Attribution-NonCommercial 4.0 International), as described at http://creativecommons.org/licenses/by-nc/4.0/.



