


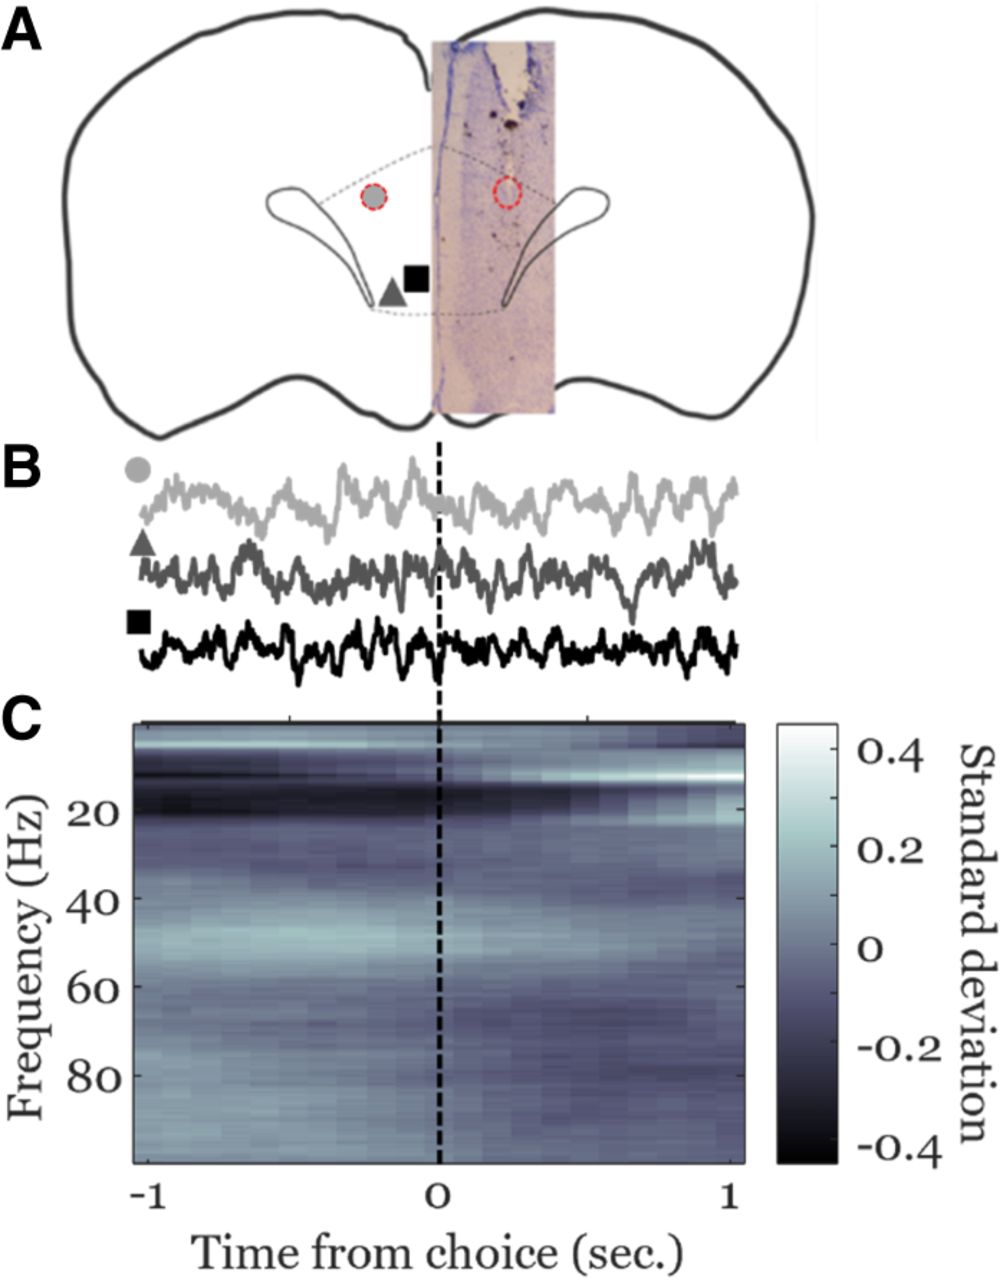
Histological placement and LFP examples. (A) Recording sites were spread throughout the prelimbic cortex. Different shapes denote tip locations for the three different animals in the data set. Sites span approximately +3.7 to +4.3 mm anterior to bregma. (B) LFP examples from each of the three recording sites, marked by corresponding shapes and shades from A. Each recording is aligned so the center of the trace is when the rat crosses the center of the maze platform, with 1 sec before and 1 sec after on either side. (C) Average spectrogram of all LFPs from across choices. Each trial's spectrogram is mean-subtracted and scaled by the standard deviation, across time, for every frequency.



