


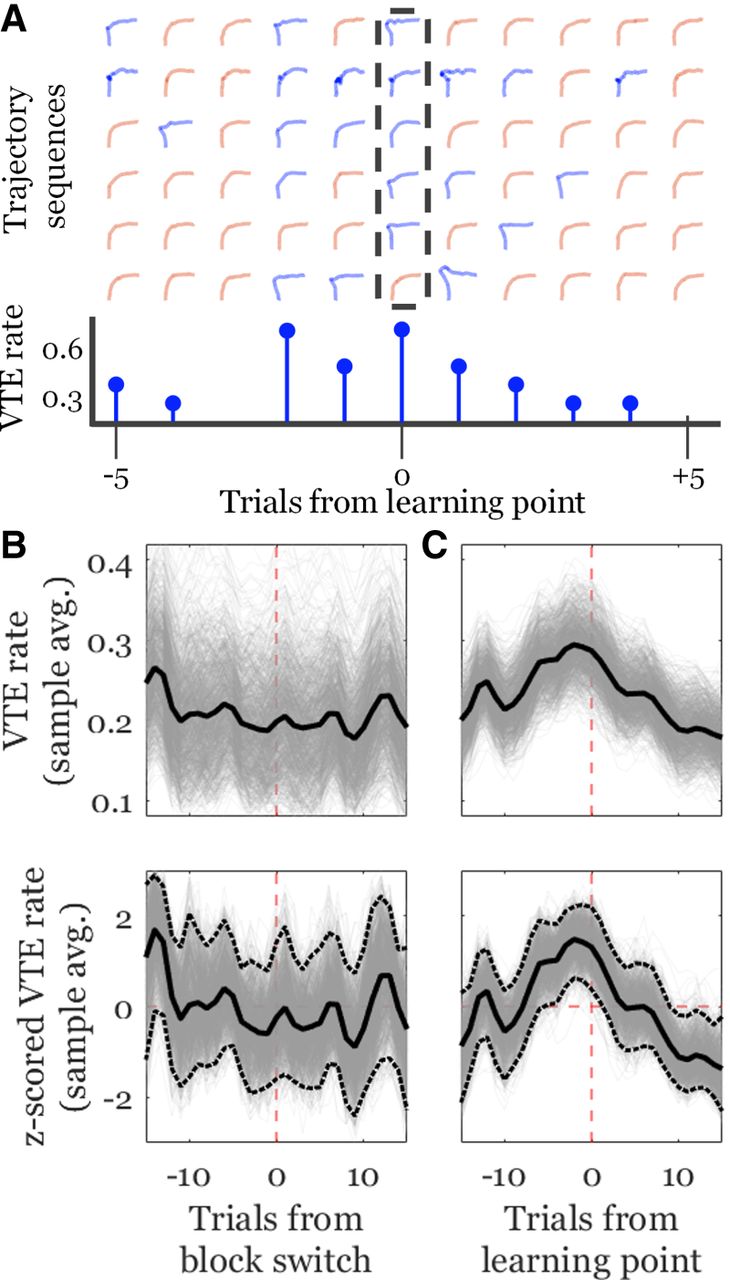
VTE rate changes align with learning points. Each row in A shows trajectories from sequences of trials aligned to estimated learning points (dashed rectangle/trial zero on the bottom axis) for a given block. Blue trajectories have been identified as VTEs and orange trajectories have been identified as non-VTEs. The stem plot shows VTE rates for this sample of six sequences. Note the general increased rate for trials near the learning point. The top panels in B and C show changes in VTE rate with respect to block switches on the left and estimated learning points on the right (dashed, vertical, red lines). For all plots, bold black lines are the averages of 1000 iterations of a hierarchical bootstrap to estimate VTE rate time series from binary vectors; light gray lines are the individual iteration results. The top panels show raw rates and the bottom plots show z-scored rates. Dashed, horizontal, and red lines in the lower plots show the mean for comparison (obscured by individual iteration results in B). Dotted black lines show the 2.5 and 97.5 percentiles of the distribution.



