


Hippocampal memory reactivation during sleep is correlated with specific cortical states of the retrosplenial and prefrontal cortices
- 1Picower Institute for Learning and Memory, Massachusetts Institute of Technology, Cambridge, Massachusetts 02139, USA
- 2Department of Brain and Cognitive Sciences, Massachusetts Institute of Technology, Cambridge, Massachusetts 02139, USA
- 3Neuroscience Program, Tulane Brain Institute, Tulane University, New Orleans, Louisana 70118, USA
- 4Department of Cell and Molecular Biology, Tulane Brain Institute, Tulane University, New Orleans, Louisana 70118, USA
- 5Center for Brains, Minds, and Machines, Massachusetts Institute of Technology, Cambridge, Massachusetts 02139, USA
- Corresponding author: mwilson{at}mit.edu
Abstract
Episodic memories are thought to be stabilized through the coordination of cortico–hippocampal activity during sleep. However, the timing and mechanism of this coordination remain unknown. To investigate this, we studied the relationship between hippocampal reactivation and slow-wave sleep up and down states of the retrosplenial cortex (RTC) and prefrontal cortex (PFC). We found that hippocampal reactivations are strongly correlated with specific cortical states. Reactivation occurred during sustained cortical Up states or during the transition from up to down state. Interestingly, the most prevalent interaction with memory reactivation in the hippocampus occurred during sustained up states of the PFC and RTC, while hippocampal reactivation and cortical up-to-down state transition in the RTC showed the strongest coordination. Reactivation usually occurred within 150–200 msec of a cortical Up state onset, indicating that a buildup of excitation during cortical Up state activity influences the probability of memory reactivation in CA1. Conversely, CA1 reactivation occurred 30–50 msec before the onset of a cortical down state, suggesting that memory reactivation affects down state initiation in the RTC and PFC, but the effect in the RTC was more robust. Our findings provide evidence that supports and highlights the complexity of bidirectional communication between cortical regions and the hippocampus during sleep.
The theory of system consolidation proposes a two-stage process for memory formation and stabilization, where information is first encoded during active behavior and then consolidated during sleep (Buzsáki 1989; McClelland et al. 1995; Stickgold 2005; Kitamura et al. 2017; Klinzing et al. 2019). This consolidation process relies on cortico–hippocampal communication (McClelland et al. 1995; Tse et al. 2007; Kitamura et al. 2017; Sawangjit et al. 2018; Holdstock et al. 2019), which has prompted the characterization of timing relationships between cortical and hippocampal sleep oscillations as vehicles of memory transfer and stabilization (Qin et al. 1997; Siapas and Wilson 1998; Sirota et al. 2003; Ji and Wilson 2007; Peyrache et al. 2009; Wang and Ikemoto 2016; Rothschild et al. 2017; Varela and Wilson 2020). While earlier efforts focused on the coupling between hippocampal sharp wave ripples (SWRs, 100–250 Hz) and cortical spindles (7–15 Hz) or delta (1–4 Hz), the emphasis in recent work has shifted to investigate the relationship between SWRs and cortical slow oscillations (SOs, 0.1–1 Hz), motivated by three important observations. First, SOs group faster sleep brain rhythms, including spindles and delta, into the complex wave patterns characteristic of slow-wave sleep (SWS) (Contreras and Steriade 1995). Second, SOs reflect the alternation between Up states (or periods of sustained cortical spiking) and down states (epochs of little or no cortical activity). Third, despite being governed by different internal fluctuations that regulate their excitable states, hippocampal spiking activity displays a comparable up/down oscillatory pattern during sleep that is temporally linked to the cortical slow oscillation (SO) (Ji and Wilson 2007; Levenstein et al. 2019). In addition, previous studies have predominantly focused on SOs, assuming their association with cortical down states, often overlooking the intricate relationship between up and down states (El-Kanbi et al. 2022). Together, these observations raise the possibility that cortical up states may serve as computational units that process information transfer from the hippocampus to support memory consolidation and other sleep-dependent cognitive processes (Ji and Wilson 2007; Penagos et al. 2017). It follows that understanding SWR and up/down state timing relationships can shed light on these sleep operations.
Importantly, the memory consolidation process is thought to involve bidirectional communications between the cortex and hippocampus during sleep. While the influence of cortical SOs on hippocampal SWRs has been well documented, several questions remain unanswered. For instance, do hippocampal SWRs only respond to SO activity or do SWRs also modulate the features of SOs? In addition, because of the strong correlation between SWRs and the reactivation of neuronal ensembles corresponding to waking experiences, a phenomenon termed hippocampal replay (Pavlides and Winson 1989; Wilson and McNaughton 1994; Skaggs and McNaughton 1996; Kudrimoti et al. 1999; Lee and Wilson 2002; Foster 2017), SWRs have been used as a proxy for memory reactivation during consolidation. Although this is supported by observations that selective elimination of SWRs during sleep leads to severe impairments in memory performance (Girardeau et al. 2009; Ego-Stengel and Wilson 2010; Aleman-Zapata et al. 2022a,b), the relationship between SOs and SWR-associated hippocampal replay is yet to be characterized. Despite studies simultaneously monitoring large-scale cortical dynamics and SWRs showing diverse coordination between SWRs (Logothetis et al. 2012; Karimi Abadchi et al. 2020; Liu et al. 2021; Nitzan et al. 2022), most of these studies lack a behavioral component that would enable exploring the relationship between hippocampal replay and SOs in multiple cortical regions.
To address these gaps in knowledge, we performed simultaneous extracellular recordings in the dorsal CA1 layer of the hippocampus and two cortical regions: the retrosplenial cortex (RTC) and prefrontal cortex (PFC). Our choice of these cortical areas stems from their close functional relationship with the hippocampus. The PFC is involved in decision-making and rule learning, while the RTC has been hypothesized to serve as a hub of information to many cortical regions, since it is one of the few cortical areas that receive projections from the dorsal hippocampus (van Groen and Wyss 1990, 1992; Wyss and van Groen 1992; Ferreira-Fernandes et al. 2019; Yamawaki et al. 2019; Opalka and Wang 2020). These close associations have motivated studies in which PFC and hippocampal interactions have been well investigated (Peyrache et al. 2009; Wierzynski et al. 2009; Carr et al. 2011; Jadhav et al. 2016; Eichenbaum 2017; Tang et al. 2017), and recent work has also started to characterize how the RTC and hippocampus communicate around SWR events (Hale 2015; Alexander et al. 2018; Karimi Abadchi et al. 2020; Nitzan et al. 2020; Opalka et al. 2020; Chambers et al. 2022; Pedrosa et al. 2022, 2023). We reason that investigating how hippocampal reactivation interacts with the RTC and PFC during sleep could help us better understand how hippocampal-related information is broadcast within distinct cortical networks whose interaction is essential to consolidation. To this end, we took advantage of multisite tetrode recordings and analyzed the local field potentials (LFPs), multiunit activity (MUA), and neuronal ensembles to focus on studying the underlying coordination of CA1 memory reactivation with slow-wave sleep (SWS)-related up and down states in the RTC and PFC.
Consistent with previous reports, we found SWRs to be highly correlated with cortical up states of the RTC and PFC (Siapas and Wilson 1998; Sirota et al. 2003; Opalka et al. 2020; Varela and Wilson 2020; Karalis and Sirota 2022). In addition, we also found that SWRs are more likely to occur before a down state in both areas, with a stronger effect in the RTC. Notably, only a minor portion of SWRs occurred during or immediately following a down state. Mirroring these findings, CA1 replays mostly occurred during sustained up states or at the transition from up to down states, with stronger coordination observed between RTC down states and hippocampal replays. Interestingly, both replays and SWRs were less likely to occur during a down state or in the down-to-up state transition, consistent with the notion that cortical activity drives hippocampal reactivation and not the other way around. Our results support the hypothesis that bidirectional communication between the hippocampus and cortical networks occurs during SWS-dependent memory consolidation. We propose that cortical activity during up states is a major driver of hippocampal memory reactivation, thus promoting the transfer of information from the hippocampus. Complementing the bidirectional relationship, CA1 reactivation is essential for transitioning from an up state to a down state. This, in addition to the role of replay in enabling the exchange between hippocampal and cortical systems, may suggest that the promotion of cortical down states could be an important component in the consolidation processes.
Results
Classification of cortico–hippocampal interactions
Cortico–hippocampal information exchange could be optimal under synchronous activity (Fries 2005; Penagos et al. 2017). Consistent with this idea, recent research has shown that hippocampal sharp wave ripples (SWRs) can be coordinated with many brain regions (Karalis and Sirota 2022; Nitzan et al. 2022). Nevertheless, there is a lack of characterization regarding the interactions between cortical up/down states and SWRs. Some have reported that SWRs may precede or follow delta-related cortical down states (Sirota et al. 2003; Battaglia et al. 2004) or that up states may contain no, single, or multiple SWRs (Ji and Wilson 2007); however, it remains unclear which types of interactions are more common within multiple cortical networks. To address this gap in knowledge, we used a classification approach based on the temporal relationship of cortical up and down states with hippocampal SWRs in the CA1 region. We investigated the interactions between hippocampal CA1 and cortical activity in the RTC and PFC during slow-wave sleep (SWS) (Figs. 1A,B, 2A1–B2; Supplemental Fig. S2D). We defined cortical up or down states as regions of high- or low-population cortical activity lasting for 100–1000 msec or 50–500 msec, respectively (Saleem et al. 2010; Karalis and Sirota 2022). Detection of up and down states was based on the distributions of the envelope of the high-frequency component (multiunit activity envelope [MUAe]) of the local field potentials (LFPs) or the multiunit activity (MUA) from detected spikes (Supplemental Fig. S2A1–C2). Similar to Ji and Wilson (2007), we observed a bimodal distribution in the MUA and MUAe of the RTC and PFC, representing the up and down cortical periods (Supplemental Fig. S2A1–C2). When recording cortical activity with a limited number of units (less than five), the MUAe was used because of its sensitivity in detecting cortical states despite the low levels of spike detection. Supplemental Figure S2, C1 and C2, shows two representations of a detected down state from the RTC or PFC. In these examples, the reduction in MUA and the MUAe during low cortical activity (down state) followed by a sudden increase in neuronal activity (up state) is noticeable.
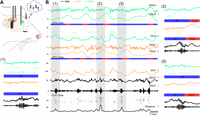
Dynamic coordination of cortico–hippocampal activity during slow-wave sleep (SWS). (A) Simultaneous extracellular recordings were made in the hippocampal CA1 (black), retrosplenial cortex (RTC), and prefrontal cortex (PFC) during the sleep of freely behaving animals. Tetrodes (gray) were placed using one of the three configurations: CA1–PFC, CA1–RTC, or CA1–RTC–PFC. The black area in this illustration corresponds to the hippocampal CA1, the orange region corresponds to the RTC, and the green region corresponds to the prefrontal cortex. (B) An example of a simultaneous triple extracellular recording between the CA1, RTC, and PFC. (Panels i–iv) The PFC raw local field potential (LFP), filtered delta (1–4 Hz), units, and multiunit envelope (high-pass filter > 500 Hz). (Panels v–viii) The RTC raw LFP, filtered delta (1–4 Hz), units, and multiunit envelope (high-pass filter > 500 Hz). (Panels ix–xii) The CA1 raw LFP, filtered ripple (125–250 Hz), units, and multiunit activity (MUA). The up (blue) and down (red) state periods in the RTC and PFC are illustrated. (Panel 1) An example of a CA1 sharp-wave ripple (SWR) occurring during cortical activity. (Panel 2) An example of a CA1 SWR occurring close to a down state region in the PFC and RTC. (Panel 3) An example of a CA1 SWR occurring close to an RTC down state while PFC was in an up cortical state.
After identifying the down and up states during sleep periods (Supplemental Fig. S2D), the subsequent analysis focused on categorizing SWRs based on whether they occurred during a cortical up or down state. To execute this classification, a 200-msec time window of the cortical MUAe or MUA was inspected. This window extended 100 msec before and after the peak amplitude of an SWR event identified in the filtered CA1 LFP (125–300 Hz) (Fig. 2). We sorted SWRs into those that happened during the up state (Fig. 2A1,A2) or down state (Fig. 2B1,B2) based on a threshold of the cortical MUAe or MUA. These two sets were then subcategorized as follows: up-to-down state transition, which is when SWRs occur right before the onset of a cortical down state (Fig. 2A1,A2 [panel ii], B1,B2 [panel i]); down-to-up state transition, which is when SWRs occur right after the end of a cortical down state (Fig. 2A1,A2 [panel i], B1,B2 [panel ii]); “sustained” up state, which is when SWRs occur in the middle of an up state (Fig. 2A1,A2, panel iii); or sustained down state, which is when SWRs occur in the middle of a down state (Fig. 2B1,B2, panel iii) period.
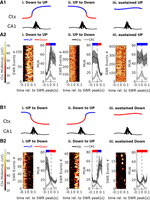
Classification of cortico–hippocampal activity. (A1,A2) Classification of SWRs that occurred during a cortical up state. (A1) Cartoon illustration of the different SWR classifications in the up state. (A2) MUA from the cortex (dark gray) and hippocampus (light gray) for different SWR classes. (Left panel) The MUAe from the cortex. (Right panel) Average MUA from the cortex and CA1. (Red) A region of a cortical down state, (blue) a region of a cortical up state. (Panel i) SWRs occurring in the down-to-Up state transition. (Panel ii) SWRs occurring in the up-to-down state transition. (Panel iii) SWRs occurring during a sustained Up state, which is characterized by the lack of detection of a down state within the 200-msec time window of analysis. (B1,B2) Classification of SWRs that occurred during a cortical down state. (B1) Cartoon illustration of the different SWR classifications in the down state. (B2) MUA from the cortex (dark gray) and hippocampus (light gray) for different SWR classes. (Left panel) The MUAe from the cortex. (Right panel) Average MUA from the cortex and CA1. (Panel i) SWRs occurring in the up-to-down state transition. (Panel ii) SWRs occurring in the down-to-up state transition. (Panel iii) SWRs occurring during a sustained down state, which is characterized by the lack of detection of an up state within the 200-msec time window of analysis.
Hippocampal SWRs are more likely to occur during specific RTC and PFC states
SWRs tend to coincide during cortical up states (Siapas and Wilson 1998; Ji and Wilson 2007; Rothschild et al. 2017; Karimi Abadchi et al. 2020; Varela and Wilson 2020; Liu et al. 2021; Kajikawa et al. 2022; Karalis and Sirota 2022), and we wanted to test whether our classification method could replicate these findings. Our results showed that SWRs in the dorsal CA1 were indeed more likely to occur during cortical up states of the retrosplenial cortex (RTC) and prefrontal cortex (PFC). Moreover, our methodology allowed us to estimate the overall occurrence of SWRs during each cortical state, which was previously unknown. Specifically, the fraction of SWRs occurring during a retrosplenial cortical up state was 0.828 (IQR: 0.791–0.871) and for down states was 0.1724 (IQR: 0.1289–0.2091). In the PFC, the fractions were 0.919 (IQR: 0.894–0.934) and 0.08 (IQR: 0.066–0.106) for up and down states, respectively (Fig. 3A). Interestingly, when compared with the PFC, the fraction of SWRs occurring during up or down states of the RTC was either smaller or larger (up, P = 0, 95% CI [−0.131, −0.042]; down, P = 0, 95% CI [0.041, 0.131]; robust ANOVA post hoc bootstrap-t). To determine whether this coordination occurred by chance, we randomly shuffled the SWRs in time and ran the classification algorithm with the same parameters as in the experimental conditions. Our results showed that the proportion of SWRs occurring during up and down states was statistically different from the shuffle in both regions (Supplemental Fig. S3A1,B1). This shuffle analysis aligns with prior research indicating that cortical up states predominate during SWS. Furthermore, the statistically significant distinction between the observed proportion of SWRs and the shuffled condition implies that the temporal coordination between SWRs and cortical Up and down states in the RTC and PFC is not random.
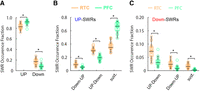
Classification and coordination of hippocampal CA1 SWR activity with the retrosplenial and prefrontal cortical up and down states. (A) Fraction of SWRs occurring during a cortical up or down state of the RTC or PFC. (B) Fraction of SWRs occurring during different classifications of the up state. States transition from down to up or up to down or are sustained (sust.) up states. (C) Fraction of SWRs occurring during different classifications of the down state. States transition from up to down or down to up or are sustained down states. RTC n = 22, eight mice; PFC n = 18, five mice. (*) P < 0.01 robust ANOVA with post hoc bootstrap-t.
This classification method offers another advantage by expanding its ability to characterize a broader range of temporal coordination, an aspect that has not been explored in previous research. Building on this, we conducted further investigations into the interactions between SWRs and cortical states, as depicted in Figures 1B and 2, A1–B2. Our findings revealed that most SWRs occurred during specific cortical up state configurations, as illustrated in Figure 3, B and C. Among the various types of coordination, the most frequent was found during the sustained up states of the RTC or PFC, as shown in Figure 3B. Our analysis involving shuffling demonstrated that this particular configuration was also the most likely to occur (Supplemental Fig. S3A2–B2). However, the occurrence rate in the experimental condition was significantly higher than that in the shuffles for both the RTC and PFC, indicating that this type of coordination is not random. Additionally, we observed that the fraction of SWRs during sustained up states was greater in the PFC than in the RTC (sust. up PFC = 0.667 [IQR: 0.615–0.721] vs. sust. up RTC = 0.349 [IQR: 0.331–0.398]; P = 0.0, 95% CI [−0.370, −0.248]; robust ANOVA post hoc bootstrap-t) (Fig. 3B). However, we did not observe stronger coordination in comparison with the RTC (Supplemental Fig. S3C1). It is possible that the increased fraction of sustained up states in the PFC is due to longer up states rather than alterations in the down state duration (Supplemental Fig. S2E1–E3) or the interevent interval (IEI) of up and down states of the RTC and PFC (Supplemental Fig. S2F1–F3). Our findings indicate that SWRs tend to occur ∼207 msec (IQR: 149–292) after the onset of sustained up states in the RTC, whereas in the PFC, the average delay is 245 msec (IQR: 174–321; P = 0.33, 95% CI [−174.336, 86.194]; robust ANOVA post hoc bootstrap-t) (Supplemental Fig. S3D1). Furthermore, the median duration of sustained up states was 349.5 msec (IQR: 328–464) for the RTC and 519 msec (IQR: 446–603) for the PFC (P = 0.12, 95% CI [−308.314, 50.029]; robust ANOVA post hoc bootstrap-t) (Supplemental Fig. S3D2). These findings suggest that during long up states in either the PFC or RTC, there is a higher likelihood of SWRs occurring within these extended states.
It is noteworthy that this particular configuration exhibited the highest level of synchrony (sust. up vs. up to down; P = 0, 95% CI [−0.677, −0.318]; robust ANOVA post hoc bootstrap-t) (Supplemental Fig. S3E1). Specifically, SWRs occurring during sustained up states displayed a median fraction of synchrony of 0.349 (IQR: 0.311–0.475) (Supplemental Fig. S3E1). Moreover, our results indicate that SWRs during up states have a greater probability of occurring during coincident RTC and PFC up states compared with when they occur during down states (Supplemental Fig. S3E1,E2). These findings align with the concept that cortical dynamics predominantly maintain a stable active state (up state) occasionally interrupted by cortical down states (Levenstein et al. 2019). Consequently, it is reasonable to expect that SWR events predominantly take place during these periods of cortical activity.
The second most frequent classification in our analysis was for SWRs occurring during a cortical up state followed by a down state (Figs. 2A1,A2 [panel ii], 3B). These SWRs were classified as up-to-down events (Figs. 2A1,A2 [panel ii], 3B). The fraction of SWRs during this transition was 0.299 (IQR: 0.294–0.321) for the RTC and 0.195 (IQR: 0.170–0.215) for the PFC. This coordination was found to be more frequent in the RTC compared with the PFC (up–down, P = 0.0, 95% CI [0.085, 0.143]; robust ANOVA post hoc bootstrap-t) (Fig. 3B). Furthermore, when examining SWRs occurring during the down state (Fig. 3C) and in the up-to-down transition configuration (Fig. 2B1,B2, panel i), we discovered that the median fraction for the RTC was higher than that for the PFC. Specifically, the RTC had a median fraction of 0.072 (IQR: 0.056–0.088), whereas the PFC had a median fraction of 0.030 (IQR: 0.023–0.040; P = 0.0, 95% CI [0.023, 0.059]; robust ANOVA post hoc bootstrap-t) (Fig. 3C). Interestingly, this classification is similar to the up-to-down configuration observed during the up state, with the only difference being a slight temporal shift in the occurrence of SWRs. Taken together, these results highlight that SWRs in CA1 have stronger temporal coordination with cortical down states of the RTC compared with the PFC. This emphasizes a notable difference in the coordination patterns between the RTC and PFC.
Although the results presented above describe the most frequent classifications, they do not provide information on the degree of coordination. To address this, we calculated the ratio between experimental and shuffle classification fractions (Supplemental Fig. S3C1,C2), which served as a metric to assess the degree of dissimilarity between experimental classification outcomes and a random process. As expected, the configurations in the up state, such as up to down (RTC 1.950 [IQR: 1.860–2.297]; PFC 1.405 [IQR: 1.316–1.564]) and sustained up (RTC 1.632 [IQR: 1.527–1.747]; PFC 1.433 [IQR: 1.360–1.486]), were the only configurations that showed ratio values >1 (Supplemental Fig. S3C1). This indicates that SWRs are strongly coupled to periods of sustained cortical activity and to up-to-down state transitions. We have also discovered that SWRs occurring in the up-to-down state configuration of the RTC and PFC exhibit a median synchrony value of 0.118 (IQR: 0.077–0.144) (Supplemental Fig. S3E1). This finding establishes this configuration as the second most synchronous state. Remarkably, among all configurations, the up-to-down configuration of the RTC displayed the highest ratio values (Supplemental Fig. S3C1). Although this type of coordination was not the most frequent or synchronous, the analysis indicates that the interaction between SWRs and the RTC during the up-to-down transition represents the most temporally coordinated pattern.
Last, our classification method revealed that SWRs occurred less frequently during the down-to-up transition of the up or down state and during sustained down states (Fig. 3B,C). What the three configurations have in common is that a down state precedes SWRs, indicating that a lack of activity from the cortex dramatically reduces the probability of SWR occurrence. To further investigate the low fraction numbers observed in these configurations, we examined whether our analysis failed to detect them and tested the reliability of the shuffle analysis. If SWR occurrence and cortical states were independent random processes, we would expect equal probability for SWRs occurring before or after a cortical down state. Consistent with this notion, we found that the fraction of SWRs in the shuffled data occurring during the up-to-down or down-to-up transitions in both the RTC and PFC were similar, regardless of whether SWRs were associated with up (P = 0.9, 95% CI [−0.016, 0.015] for the RTC; P = 0.94, 95% CI [−0.018, 0.018] for the PFC; robust ANOVA post hoc bootstrap-t) (Fig. 2A1,A2, panels i,ii) or down (P = 0.868, 95% CI [−0.021, 0.019] for the RTC; P = 0.734, 95% CI [−0.014, 0.011] for the PFC; robust ANOVA post hoc bootstrap-t) (Fig. 2B1,B2, panels i,ii) states. Furthermore, all these configurations had a fraction value smaller than their respective shuffles (Supplemental Fig. S3A2,A3,B2,B3,C1,C2). This analysis allows us to draw several conclusions. First, the lower fraction of down-to-up and all down configurations compared with their respective shuffles indicates that the low occurrence of these configurations is not due to limitations in the detection method. Second, the shuffle analysis successfully captured the independent nature of the shuffled data, indicating that the coordination of SWRs and cortical states in each configuration is well coordinated and far from a random interaction.
The temporal coordination between SWRs and down states is stronger in the RTC than in the PFC
In this section, we focus on identifying the reasons behind the higher likelihood of certain cortico–hippocampal configurations, particularly those where SWRs occurred during the transition from up to down, which is the most coordinated configuration between hippocampal CA1 and the RTC (Supplemental Fig. S3C1). To determine this, we examined the onset of down states in the RTC and PFC and CA1 SWR delta phase distributions (Fig. 4B1–B3). Prior studies have established a correlation between delta oscillations and cortical down states during slow-wave sleep (SWS). This correlation is similar to what we observed in Figure 4A, where the appearance of down states in the RTC and PFC is correlated with an increase in power from low-frequency oscillations like delta. Therefore, our first analysis aimed to determine whether the onset of detected down states was coupled with the delta phase. Our results showed that the delta phase distribution for the onset of down states of the RTC and PFC was phase-coupled (Fig. 4B1–B3, Rayleigh's test P < 0.01). The average delta phase distribution for the onset of down states of the RTC was 145° and for the PFC was 120°. In addition to analyzing the delta phase, we also conducted a perievent time histogram analysis to investigate the potential relationship between delta power and the detected cortical down states. Supplemental Figure S5C1 demonstrates an increase in delta power immediately following the onset of a cortical down state in the RTC or PFC, demonstrating that the detection of cortical down states is both phase- and amplitude-correlated to delta oscillations. Next, we examined the phase distribution of hippocampal SWRs to the delta wave of the RTC and PFC. The delta phase distribution for SWRs with respect to delta in the RTC was 150° and for the PFC was 30°. As previously reported, SWRs in CA1 are temporarily phase-coupled to delta waves from the RTC and PFC. However, our analysis uncovered an interesting observation regarding the absolute differences between the SWR–delta phase and the onset of delta phase distribution of down states. Notably, these differences were smaller in the case of the RTC compared with the PFC (P = 0, 95% CI [−77.646 −37.848]; robust t-test bootstrap-t) (Fig. 4B3). This indicates that SWRs and the onset of delta-related down states in the RTC tend to occur in closer phases compared with the PFC. Furthermore, we validated these findings by conducting a perievent time histogram analysis on SWRs observed in the up-to-down state configurations. Supplemental Figure S5C2 illustrates that the delta power increases for both the RTC and PFC. Notably, in the case of the PFC, there is a slight shift in the power distribution of delta. This finding provides a partial explanation for the higher occurrence of SWRs during the Up-to-down transition in the RTC, as depicted in Figure 3B. However, it also raises the question of whether the time window used for classification may introduce a bias toward down states in the RTC, since they occurred slightly closer to SWRs. Nevertheless, we believe this was not the case, as the onset of down states in our recordings peaked at 28.9 msec for the RTC and 44.12 msec for the PFC (Fig. 4C1,C2). This leaves a time window of 71 msec for the RTC and 56 msec for the PFC for down state detection, both exceeding the minimum required duration (>50 msec) for classification as a down state.
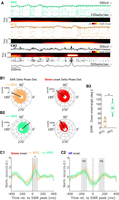
SWR and down state delta phase distributions and up/down state onset perievent time histograms. (A) An example of a simultaneous triple extracellular recording between the CA1, RTC, and PFC. The PFC raw local field potential (LFP), filtered delta (1–4 Hz black), units, MUA firing rate, and spectrogram. The RTC raw LFP, filtered delta (1–4 Hz black), units, MUA firing rate, and spectrogram. CA1 raw LFP, filtered ripples (125–300 Hz gray), spectrogram, units, and MUA. (B1–B3) SWR and down state delta phase distributions. (B1) RTC SWR (orange) and down state (red) delta phase distributions. Four mice, n = 14. (B2) SWR and down state delta phase distributions. (B2) PFC SWR (green) and down state (red) delta phase distributions. Four mice, n = 14. (B3) The absolute value of the difference between the delta phase average from SWRs and the down state onsets from the RTC or PFC. (C1,C2) Perievent time histograms for the RTC and PFC down (C1) and up (C2) state onsets during SWRs. (*) P < 0.01, (ns) P > 0.05. Only simultaneous triple recordings were included in the analysis.
Next, we investigated the possibility of hippocampal SWRs increasing the probability of cortical down states of the RTC and PFC. To do so, we performed a perievent time histogram analysis on cortical up and down states that occurred during SWRs (Fig. 4C). We examined a time window of 800 msec (400 msec before and after the peak of SWRs) and looked at the onset of cortical down states in the RTC and PFC (Fig. 4C1). We found that the probability of a down state onset increased shortly after the appearance of an SWR, with the lowest point occurring 200–150 msec before the SWR and then suddenly increasing after the SWR. This finding is consistent with the down state/delta-related (type 1 slow wave) activity described in El-Kanbi et al. (2022), as well as the reported correlation between the rate of SWRs and down states in the PFC by Karalis and Sirota (2022). However, we observed a greater peak probability of down state onset in the RTC than in the PFC, indicating stronger coordination between hippocampal SWRs and the RTC down state onset. The z-score median peak amplitude of a down state onset in the RTC was twice as large as that in the PFC (RTC 3.087 [IQR: 2.934–3.525]; PFC 1.413 [IQR: 1.178–1.939]; P = 0, 95% CI [1.269, 2.033]; robust t-test bootstrap-t) (Fig. 4C1; Supplemental Fig. S5A1). To calculate the variance and timing of the perievent histogram between 0 and 100 msec (gray region in Fig. 4C1) after an SWR peak, we fitted a Gaussian curve. Consistent with our previous finding that the delta phase distributions for the RTC and SWRs were more closely aligned than the phase distributions between SWRs and the PFC, we found that the onset of a down state peaked at a median of 28.89 msec (IQR: 26.35–32.40 msec) for the RTC and 44.12 msec (IQR: 41.55–48.37 msec) for the PFC (P = 0, 95% CI [−19.040, −11.382]; robust t-test bootstrap-t) (Fig. 4C1; Supplemental Fig. S5A3). Additionally, we noted a decrease in the variance of the onset of down state in the RTC compared with the PFC, with a variance of 38.44 (IQR: 35.50–44.91) for the RTC and 54.55 (IQR: 51.73–85.22) for the PFC (P = 0, 95% CI [−52.615, −12.478]; robust t-test bootstrap-t) (Supplemental Fig. S5A2). A decrease in variance is also an indication that the initiation of the RTC down states is more tightly linked to SWRs in CA1 than down states in the PFC. To ensure that these results were not influenced by variations in the quality of the Gaussian fit, we conducted a comparison of the root-mean-square deviation (RMSD) for each fit. The median RMSD values were similar for both groups, with 0.490 (IQR: 0.376–0.631) for the RTC and 0.508 (IQR: 0.424–0.667) for the PFC (P = 0.68, 95% CI [−0.197, 0.122]; robust t-test bootstrap-t) (Supplemental Fig. S5A4).
Additionally, we investigated whether the stronger coordination between SWRs and down states from the RTC was specific to down states. To examine this, we analyzed the perievent time histogram for the onset of cortical up states in the RTC and PFC (Fig. 4C2). Our observations revealed that up state onsets typically occurred ∼150–200 msec before or after an SWR event (Fig. 4C2). Notably, the likelihood of an up state onset before an SWR was slightly higher compared with the peak amplitude after an SWR (Fig. 4C2). For the RTC, the median z-score peak amplitude for an up state onset before and after an SWR was 2.289 (IQR: 1.790–2.598) and 1.2405 (IQR: 0.519–1.371), respectively, while for the PFC it was 1.786 (IQR: 1.626–1.931) and 0.907 (IQR: 0.795–1.300), respectively (RTC P = 0, 95% CI [0.519, 1.939]; PFC P = 0.005, 95% CI [0.413, 1.155]; robust ANOVA post hoc bootstrap-t). However, there was no difference in the occurrence of up state onset before or after an SWR event when comparing the RTC and PFC (RTC vs. PFC before P = 0.114, 95% CI [−0.092, 0.969]; RTC vs. PFC after P = 0.972, 95% CI [−0.545, 0.533]; robust ANOVA post hoc bootstrap-t) (Fig. 4C2, gray areas; Supplemental Fig. S5B1,B2). Based on the higher probability of an RTC or PFC up state occurring before an SWR, our results support the notion that cortical up state activity can influence SWR occurrence.
Next, we performed a perievent time histogram analysis to determine whether MUA from the cortex during SWRs classified as sustained up states could influence the duration of hippocampal SWRs. SWRs were categorized as either “short” (<60 msec) or “long” (>100 msec), following a definition similar to that of Fernández-Ruiz et al. (2019). As illustrated in Supplemental Figure S5, D1 and D3, MUA from the RTC and PFC consistently preceded the SWRs by ∼250 msec, which aligned with our previous findings in Figure 4C2. Additionally, we observed that MUA from the RTC and PFC during long-duration SWRs occurring during sustained up states exhibited a higher peak amplitude compared with short SWRs (Supplemental Fig. S5D1–D4). Specifically, the z-score peak amplitude of MUA from the RTC was 0.402 (IQR: 0.324–0.508) for short SWRs and 0.528 (IQR: 0.473–0.657) for long SWRs. For the PFC, the z-score peak amplitude was 0.21 (IQR: 0.19–0.275) for short SWRs and 0.348 (IQR: 0.278–0.377) for long SWRs. These findings suggest that higher cortical activity might be associated with longer SWRs in CA1. Additionally, it is important to note that MUA from both cortical regions consistently preceded the hippocampus, reinforcing the idea that cortical activity can influence SWR properties like occurrence and duration. Furthermore, our analysis indicates that SWRs do not appear to affect the initiation of cortical up states in the RTC and PFC. Instead, their primary impact seems to be on down state initiation, with a more pronounced effect observed in the RTC. Thus, a higher probability of a up state preceding an SWR serves as an indicator of SWR occurrence, while higher cortical activity could potentially modulate the duration of SWRs.
Previous and new reports have suggested that during up states, SWRs interact with delta-related up states (El-Kanbi et al. 2022) and spindle activity (Siapas and Wilson 1998; Ngo et al. 2020). Therefore, we analyzed the perievent histogram of delta and spindle power for SWRs classified as sustained up states in the RTC and PFC (see Supplemental Fig. S5E1–F3). First, we found that delta power preceding SWRs during sustained up states in the RTC and PFC is high and then is significantly reduced during the peak occurrence of the SWRs. The kinetics of delta power appears to be similar to the type 2 classification of SWRs from El-Kanbi et al. (2022), where delta-related up states peak around −270 msec before SWRs. Additionally, we observed that spindle activity increases as delta power decreases (Supplemental Fig. S5E1–F1). This suggests that delta-related up states may trigger spindle-like activity, which is then temporally correlated with SWRs. We also investigated whether short- and long-duration SWRs classified as sustained up states exhibit different kinetics, similar to what we observed in our previous MUA results. In the RTC, we found that delta power after long-duration sustained up state SWRs shows an increase (Supplemental Fig. S5E2), whereas spindle power remains similar for both short- and long-duration SWRsS (P = 0.117, 95% CI [−0.197, 0.122]; robust t-test with bootstrap-t) (Supplemental Fig. S5F2). The median z-score of delta power after SWRs in the RTC was 1.1605 (IQR: 0.9537–1.2062) for short-duration SWRs and 1.4356 (IQR: 1.2221–1.8105) for long-duration SWRs (P = 0.013, 95% CI [−1.744, −0.491]; robust ANOVA post hoc with bootstrap-t) (Supplemental Fig. S5E2). In the PFC, we observed a different scenario. The delta power was similar for both short- and long-duration SWRs (before, P = 0.874, 95% CI [−0.427, 0.78]; after, P = 0.874, 95% CI [−0.953, 0.711]; robust ANOVA post hoc with bootstrap-t) (Supplemental Fig. S5E3), but for long-lasting SWRs, the spindle power was higher (P = 0.009, 95% CI [−2.158, −0.407]; robust t-test with bootstrap-t) (Supplemental Fig. S5F3).
Taken together, and in agreement with our previous results, these data support the idea that hippocampal SWRs have a stronger modulation of delta-related activity in the RTC than in the PFC. Additionally, we found that spindle activity in both the RTC and PFC is temporally correlated with sustained up state SWRs. The increase in spindle activity occurred during SWRs, similar to the spindle–SWR coordination observed in previous reports (Siapas and Wilson 1998; Ngo et al. 2020; Pedrosa et al. 2022). However, long-duration SWRs seem to be more coordinated with spindle activity in the PFC, while an increase in RTC spindle power was associated with both short- and long-lasting SWRs. This analysis highlights new differences in cortico–hippocampal interactions, where delta-related activity in the RTC seems to be modulated by hippocampal activity, whereas spindle activity in the PFC appears to be differently modulated depending on the duration of SWRs.
CA1 replays occur during specific cortical states of the RTC and PFC
Next, we examined the relationship between memory reactivation (replays) in the hippocampus and its interaction with cortical states of the RTC and PFC. The model for the system consolidation suggests that during sleep, the hippocampus replays neural activity patterns from wakefulness, which is essential for the memory consolidation. Our experimental findings indicate that the most favorable forms of interaction between SWRs in the CA1 region and the cortical states of the RTC and PFC occur either during sustained up states in the cortex or during the transition from up to down. However, it is unclear whether hippocampal replays follow the same timing with respect to cortical states.
To answer this question, we recorded place cells in the hippocampal CA1 while mice were running in a familiar linear track of ∼200 cm (Fig. 5A1). We then used Bayesian decoding to detect spatial trajectories from the spiking activity of hippocampal place cells during sleep. To validate our approach, we created an encoding model using 80% of the data while the animal was running in the linear maze and subsequently predicted the animal's position on the remaining 20% of run data, based on CA1 spiking activity. Figure 5, A2 and A3, shows the confusion matrix and decoding error cumulative distribution of a single experimental session, demonstrating our ability to estimate the positions of the mice on the maze (median error 4.81 cm). Next, we applied the model to the spiking activity during sleep to detect replays. First, we selected periods of elevated spiking activity (Davidson et al. 2009; Wu and Foster 2014; Chen and Wilson 2017; Liu et al. 2018) as candidate replay events. Using the maximum likelihood estimator (MLE) at each time point (Davidson et al. 2009; Wu and Foster 2014; Chen and Wilson 2017; Liu et al. 2018), we assessed the spatio–temporal structure of each candidate event by applying linear and weighted distance correlations between MLEs and time. The resulting correlation values were assessed for statistical significance by comparing them with distributions of spatio–temporal correlations obtained from randomly shuffled spiking data (Davidson et al. 2009; Wu and Foster 2014; Chen and Wilson 2017; Liu et al. 2018; Tingley and Peyrache 2020).
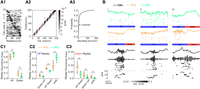
Coordination of hippocampal replays and cortical states of the RTC and PFC. (A1–A3) Bayesian decoding using place tuning units from hippocampal CA1. (A1) Firing rate of CA1 units in a linear maze. Units were ordered based on their place field. (A2) Confusion matrix showing the distribution of the actual position of a mouse and the estimated position from the decoding model. (A3) Empirical cumulative distribution function (CDF) of decoding errors. The arrow represents the median error in estimating the position for a single animal experiment. (B) Replay examples and their coordination to cortical states of the RTC and PFC. (Green) LFP and units of the PFC; (orange) the LFP and units of the RTC; (black) the LFP, filtered LFP ripples, units, and replay position reconstruction of CA1. (Panel i) An example of a replay that was coordinated with an up-to-down transition in the RTC but remained in a sustained up state in the PFC. (Panel ii) An example of a replay coordinated to sustained up states of the RTC and PFC. (Panel iii) An example of a replay coordinated to an up-to-down transition in the RTC and PFC. (C1–C3) Classification and coordination of hippocampal replays with the retrosplenial and prefrontal cortical up and down states. (C1) Fraction of replays occurring during a cortical up or down state of the RTC or PFC. (C2) Fraction of replays occurring during different classifications of the up state. States transitioned from down to up or up to down or were sustained (sust.) up states. (C3) Fraction of replays occurring during different classifications of the down state. States transitioned from up to down and down to up or were sustained down states. RTC n = 11, three mice; PFC n = 11, two mice. (*) P < 0.01 robust ANOVA with post hoc bootstrap-t.
In Figure 5B, we show a sample of three replayed sequences detected in CA1 using our replay detection method. To study replay interaction with cortical states of the RTC and PFC, we used the same classification method to investigate the fraction of replays that occurred during the up and down states of the RTC and PFC. Consistent with our earlier findings showing a higher probability of SWRs occurring during cortical up states, we observed that replays were more likely to occur during cortical up states than during down states of the RTC and PFC (RTC up vs. down, P = 0, 95% CI [0.523, 0.732]; PFC up vs. down P = 0, 95% CI [0.788, 0.927]; robust ANOVA post hoc bootstrap-t) (Fig. 5C1). Hippocampal replays occurring during an up state had a median occurrence fraction of 0.817 (IQR: 0.773–0.863) for the RTC and 0.936 (IQR: 0.901–0.955) for the PFC. Conversely, the median fraction of replays occurring during down states was 0.183 (IQR: 0.137–0.227) for the RTC and 0.064 (IQR: 0.045–0.099) for the PFC. These results provide evidence that hippocampal reactivation is strongly coordinated with up states of multiple cortical regions such as the RTC and PFC.
Next, we investigated other types of coordination between memory reactivation from hippocampal CA1 and the cortical states of the RTC and PFC. As previously found, hippocampal sequences during sleep are less likely to occur during the transition from the down to the up state of the RTC or PFC. The median fraction of replays occurring during this transition was 0.086 (IQR: 0.066–0.097) for the RTC and 0.053 (IQR: 0.049–0.062) for the PFC, making this configuration the least likely of the up state configurations (Fig. 5C2). Furthermore, replays in CA1 during down states have the lowest probability among all configurations. For example, replays occurring during sustained down states have the lowest occurrence probability, with a median fraction of 0.013 (IQR: 0.010–0.016) for the RTC and 0.003 (IQR: 0.000–0.003) for the PFC. The second lowest occurring probability was for replays occurring during the down-to-up transition of a down state, with a median fraction of 0.021 (IQR: 0.020–0.031) for the RTC and 0.008 (IQR: 0.004–0.012) for the PFC (see Fig. 5C3). Interestingly, these two configurations have the second largest window of cortical inactivity of all classifications. In contrast, the down state configuration where replays occur in the transition from up to down, which is the configuration where cortical activity precedes the occurrence of a replay, was the most frequent configuration in this group (Fig. 5C3). The median occurrence fraction for these replays was 0.085 (IQR: 0.059–0.088) for the RTC and 0.029 (IQR: 0.021–0.042) for the PFC (see Fig. 5C3). This indicates that periods of cortical inactivity greatly reduce the probability of hippocampal reactivation.
Finally, and similar to our previous results, we found that the most likely coordination between hippocampal replays and the cortex occurs during the up state configuration, such as the sustained up states and in the transition from up to down of the RTC and PFC (Fig. 5C2). In particular, we found that the median fraction of replays occurring during sustained up states was stronger in the PFC (0.6335, IQR: 0.6006–0.6755) compared with the RTC (0.3784, IQR: 0.3463–0.4311; P = 0, 95% CI [−0.368, −0.137]; robust ANOVA post hoc bootstrap-t) (see Fig. 5C2), indicating that memory reactivation from hippocampal CA1 is more likely to interact with the PFC and RTC during periods of prolonged cortical activity, but this coordination is stronger between replays and the PFC. The second most probable configuration for replays was during the transition from up to down of the RTC and PFC, with a median fraction of occurrence of 0.297 (IQR: 0.288–0.303) for the RTC and 0.222 (IQR: 0.217–0.232) for the PFC (Fig. 5C2). Interestingly, replays showed stronger coordination with the up-to-down transition of the RTC compared with the PFC (P = 0, 95% CI [0.050, 0.094]; robust ANOVA post hoc bootstrap-t) (Fig. 5C2). It is worth noting that in both configurations, cortical activity preceded hippocampal replays, indicating a loop-like coordination between the cortex and hippocampus.
Our data provide evidence that prolonged or sustained periods of cortical activity increase the likelihood of memory reactivation, whereas extended periods of cortical inactivity significantly reduce the probability of hippocampal SWRs and replay occurrences. Additionally, we observed that memory reactivation in the hippocampus triggers the transition from the up to the down state in both the RTC and PFC. These findings support the notion of a bidirectional interaction between the cortex and hippocampus, where hippocampal reactivation serves dual purposes: transmitting sequences to the cortex and promoting the initiation of the down state, the latter likely serving as a mechanism to minimize memory interference.
Discussion
Here, we report coordinated activity between hippocampal sharp wave ripples (SWRs) in CA1 and the retrosplenial cortex (RTC) and prefrontal cortex (PFC) during slow-wave sleep (SWS). We used a novel classification method to investigate distinct patterns of communication between SWRs and the RTC and PFC. Our findings demonstrate that SWRs and their interaction with the cortical activity are not random but consistent with the idea of two-way communication between these regions. Hippocampal SWRs and replays are more likely to occur during specific cortical states such as sustained cortical activity (up states) or during periods in the state transition from up to down. One consistent observation across these configurations is that cortical activity precedes SWRs and memory reactivation in the hippocampus. The probability of a replay or SWR occurrence is higher after 150–200 msec following the initiation of a cortical up state. In contrast, SWRs or replays occurring during prolonged down states or in the state transition from down to up are much less frequent, indicating that periods of inactivity greatly reduce the probability of SWRs and memory reactivation. We hypothesize that cortical input into the hippocampus is a major driver of hippocampal reactivation. Additionally, we observed that SWRs and replays often occur during the cortical state transition of up to down of the RTC and PFC. The onset of a down state of the RTC and PFC occurs within 30–50 msec after the peak of SWRs. In contrast to the occurrence of the onset of a cortical up state, the initiation of a down state before an SWR shows an oscillatory behavior that is disrupted after the appearance of an SWR. This suggests that SWRs and replays can provide feedback input into cortical regions such as the RTC and PFC by locally increasing the probability of a down state. Importantly, hippocampal feedback seems to have a different impact depending on the cortical region because the coordination of down state onsets and the fraction of SWRs and replays occurring during the state transition of up to down is greater between the hippocampus and RTC.
Differences in retrosplenial and prefrontal cortical state interactions between SWRs and replays
Our findings revealed several interactions between hippocampal reactivation and the RTC and PFC. Specifically, during sustained up states, we observed that this was the most frequent type of interaction between SWRs/replays and the PFC and RTC. Notably, the frequency of these interactions was higher for the PFC compared with the RTC, challenging the prevailing notion that slow oscillations (SOs) during slow-wave sleep (SWS) are uniformly synchronized across all cortical regions. Our findings highlight the complexity and diversity in the coordination of SWRs and replays with the cortical state activity of the PFC and RTC. We propose that this interplay is not solely reliant on synchronized activity but involves dynamic flexibility, allowing for selective coordination. This intricate interplay could enable the hippocampus to transmit information to the cortex through various mechanisms.
Other oscillations that are crucial for memory consolidation, such as cortical spindles and high-frequency (ripple-like) oscillations, have a tendency to occur during cortical up states (Siapas and Wilson 1998; Khodagholy et al. 2017; Aleman-Zapata et al. 2022b; Dahal et al. 2023). This suggests that during sustained up states, there is a high probability of SWRs interacting with spindles or high-frequency oscillations in the RTC and PFC. Spindles are particularly interesting because various studies have observed their occurrence during SWRs or following a delta/down state (Latchoumane et al. 2017). For example, recent research by Pedrosa et al. (2023) has discovered that RTC spindles coincide with SWRs, as previously reported by Siapas and Wilson (1998) in the PFC. Here, we observed that spindle power increases after delta-related up states of SWRs that occurred during sustained up states of the RTC and PFC. Interestingly, this type of interaction differs from the classical down state/delta wave/spindle interaction and suggests that delta/up state-related activity could also be accompanied by spindle activity. Moreover, we also found that RTC spindle activity is high for both short- and long-duration SWRs, whereas in the PFC, spindle activity is stronger during long-duration SWRs. These results partially disagree with the findings of Pedrosa et al. (2023), where they observed a stronger correlation between long-duration SWRs and spindles. However, our findings align with the report by Ngo et al. (2020), which suggests that spindle activity from the human prefrontal cortex is associated with longer-duration SWRs.
The second most frequent type of interaction in our classification method was during the state transition from up to down of the RTC and PFC. SWRs preceding a cortical down state (up to down) have been reported in several cortical regions such as the sensory cortex (Sirota et al. 2003), PFC (Peyrache et al. 2009; Karalis and Sirota 2022), and RTC (Opalka et al. 2020; Karimi Abadchi et al. 2023). In agreement with those studies, we also saw strong coordination between SWRs and cortical down states of the RTC and PFC; however, we are the first to report that this coordination is more robust between the hippocampus and RTC. Moreover, our shuffle analysis demonstrated that SWRs occurring in the up-to-down configuration of the RTC were the most coordinated interaction despite not being the most frequent. We reason that memory reactivation in the hippocampus will exert a higher cortical influence in areas of the RTC than in the PFC with respect to promoting down state generation. Global up/down states are thought to be generated by the thalamocortical and cortico–cortical networks, likely playing a key role in the coordination of various cortical regions (Connelly et al. 2015; Narikiyo et al. 2020; Vaasjo et al. 2022). Here, our study reveals that the hippocampus has the capacity to locally coordinate down states in both the PFC and RTC, with a more significant impact observed in the RTC. We reason that locally coordinating activity in cortical regions through hippocampus inputs could be an important mechanism for information processing.
Additionally, it is important to mention that a portion of these results differs from a study by Navarro Lobato et al. (2023), who found that SWRs occurring after delta waves are more frequent than those occurring before a delta wave. We speculate that the source of this discrepancy could be attributed to differences in methodology. Specifically, Navarro Lobato et al. (2023) used a time window of 50–400 msec for analyzing delta/SWR interactions, while their analysis of SWR/delta interactions used a time window of 50–250 msec. In our analysis, a consistent time window of ±100 msec was used for detecting SWRs both preceding and following a down state. We believe that the difference in the chosen time windows might be a contributing factor to the disparity between their findings and ours. Nonetheless, we also consider the possibility that the higher frequency of SWRs occurring after a delta wave in the study by Navarro Lobato et al. (2023) could be linked to type 2 SWRs as documented in El-Kanbi et al. (2022) or to sustained up state SWRs as observed in our research. This is possible because prior studies used an amplitude threshold for their delta wave detection, which could lead to erroneous identification of delta-related up states as down state activities (El-Kanbi et al. 2022). We demonstrated in Supplemental Figure S5E1 that delta power peaks around −270 msec before a sustained up state SWR, a time frame analogous to the one used by Navarro Lobato et al. (2023) for detecting delta/SWR events. Therefore, assuming that the proportion of SWRs occurring after a delta wave in the study by Navarro Lobato et al. (2023) is indeed linked to sustained up state SWRs, we can conclude that our results are in agreement. This implication suggests that SWRs occurring during sustained up states represent the most frequent form of interaction between the cortical regions of the RTC and PFC.
A buildup of excitation from the cortex and circuit dynamics is responsible for the coordination of SWRs and replays during cortical up states
Our research findings show that memory reactivation in the hippocampus is strongly coordinated with cortical up states of the RTC and PFC, which may be attributed to anatomical and circuit dynamic interactions. We observed a delay of 150–200 msec before SWRs and replays reached their peak occurrence probability, which explains the higher fraction of SWRs/replays occurring during sustained up state configurations in our classification method. The delay in SWR and replay occurrence is in line with the idea that a buildup of cortical excitation may be responsible for the increased probability of memory reactivation in the hippocampus. This may also explain why SWRs and replays are less likely to be observed immediately during the onset of cortical up states (down-to-up transition) or during down state configurations. However, the anatomical complexity of brain regions must also be taken into consideration, as information needs to travel and interact through different circuits before promoting SWRs and memory reactivation in the CA1 and therefore contributing to the observed delay in our results.
Interestingly, recent evidence from simultaneous intracellular and extracellular recordings in hippocampal CA1 and CA3, the dentate gyrus (DG), and the cortex has revealed that a complex and lengthy process could ultimately trigger the occurrence of SWRs in CA1 (Kajikawa et al. 2022). Even though the mechanism for SWR initiation is not known, experimental evidence suggests that hippocampal regions from CA2 and CA3 are important in promoting SWRs and replays in CA1 (Oliva et al. 2016; Yamamoto and Tonegawa 2017; Davoudi and Foster 2019; de la Prida 2020; Ecker et al. 2022). However, recent research conducted by Kajikawa et al. (2022) highlights the significance of cortical input in coordinating hippocampal activity. Their study found that cortical up states play a crucial role in modulating the membrane potential of DG, CA3, and CA1 neurons. Interestingly, the study observed that in CA1, the cell membrane potential is depolarized ∼100 msec prior to the initiation of SWRs, where the depolarization period was coordinated with the cortical up state. This observation is particularly important because the duration of this depolarization coincides with our finding that the peak occurrence probability of a cortical up state occurs ∼150 msec before/after the occurrence of an SWR. Based on these results, prolonged and coordinated interactions between cortical and hippocampal pathways are critical for initiating SWRs in CA1. We reason that the cortex mostly mediates the buildup of excitation in the hippocampus, which in conjunction with circuit dynamics plays an essential role in memory reactivation within the hippocampus.
The probability of SWR and replay occurrence is low during cortical down states
The hypothesis of circuit dynamics and buildup excitation is useful in explaining the strong coordination between SWRs and replays to cortical up states. However, this does not explain why a minority of SWRs and replays occurs during cortical down states. Replays during down states are believed to be instances where the hippocampus leads the transfer of information (Karimi Abadchi et al. 2020; Nitzan et al. 2020). Our study found that the probability of coordinated activity where hippocampal SWRs precede cortical up states is low. Nevertheless, we recognize that this coordination may still be crucial for memory consolidation. Experimental and computational evidence indicates that hippocampal–hippocampal connections have the circuit capacity to generate SWRs and replays without the need for external input (Buzsáki 2015). This could indicate that SWRs observed during down states may be generated by internal hippocampal circuits such as from CA3 and CA2, in which, without cortical input, they may represent a group of replays where their content is purely influenced by internal hippocampal computations.
Alternatively, it is plausible that these SWRs and replay events that occurred during down states of the RTC or PFC are triggered by other cortical regions and as a result may not represent a “leading” scenario for the hippocampus. For example, the medial entorhinal cortex (MEC) is known to undergo spontaneous persistent activity (SPA), a phenomenon that allows the MEC to skip up/down state cycles from neocortical regions (Egorov et al. 2002; Yoshida et al. 2008; Hahn et al. 2012; Choudhary et al. 2022). If the MEC skips a neocortical down state (e.g., from the RTC or PFC) and stays in the up state instead, it could increase the likelihood of SWRs and replays in CA1 that occurred during down states of the RTC or PFC. The average occurrence rate of SPA in MEC neurons is ∼5%–20%, which is similar to the overall occurrence rate of replays and SWRs that we reported during down states. Although we are uncertain about the extent to which SPA in the MEC could influence memory reactivation in the hippocampus, research has shown that optogenetic inhibition of MEC inputs to CA1 can decrease the probability of SWRs and replay initiation (Yamamoto and Tonegawa 2017). Therefore, we believe that the low numbers of replays that occur during cortical down states of the RTC or PFC are influenced by other cortical regions such as the MEC. This hypothesis could further diminish the role of the hippocampus in leading the information exchange to the cortex, since under such circumstances, distinct cortical regions could be the ones dictating the timing of hippocampal memory reactivation.
Down states of the RTC are strongly coordinated to hippocampal SWRs/replays
The occurrence of down states in the RTC and PFC reaches its peak shortly after an SWR in dorsal CA1, which indicates that the probability of a cortical down state in the RTC and PFC is increased by hippocampal reactivation. Coordination between down states in the RTC and SWRs/replays was found to be stronger than that observed between down states in the PFC. This finding is supported by a higher fraction of SWRs and replays occurring in the up-to-down configuration and increased likelihood of a down state following an SWR. The reason for the difference in coordination is unclear but may relate to anatomical and circuit dynamics.
The PFC and hippocampal interactions occur through direct and indirect projections from the intermediate and ventral hippocampus to the PFC (Eichenbaum 2017). These projections are both excitatory and GABAergic (Melzer and Monyer 2020). SWRs in the ventral, intermediate, and dorsal CA1 are not synchronous, but strong SWRs (which are those with large recruitment of neurons) can propagate through the longitudinal axis of the hippocampus (Sosa et al. 2020; De Filippo and Schmitz 2023). Modulation of GABAergic circuits in cortical layers has been involved in the regulation of cortical down states (Fanselow and Connors 2010; Zucca et al. 2017; Jackson et al. 2018; Narikiyo et al. 2020). We thus hypothesize that certain SWRs in the dorsal CA1 can propagate through ventral and intermediate hippocampal projections that could directly modulate a population of GABAergic cells in the PFC either directly or indirectly via the thalamus, which can then facilitate down states in the PFC. In contrast, the RTC receives hippocampal projections from the dorsal area, and the mechanism of how they can modulate down states in the RTC is better understood. Opalka et al. (2020) demonstrated that specific optogenetic stimulation of the axons of the dorsal hippocampus in the RTC can cause a biphasic modulation of inhibitory and excitatory neurons from the RTC. Either optogenetic stimulation or basal SWRs promoted excitatory cells in the RTC to increase their firing rate, followed by a rapid inhibitory period. The inhibitory cells, on the other hand, were modulated directly but with a delay in their firing rate. This finding suggests that the coordination observed between SWRs and the transition of the cortical state from up to down in the RTC is possible due to the robust modulation of RTC inhibitory circuits via hippocampal projections.
In addition to the difference in dorsal versus ventral hippocampal projection to the RTC and PFC, a new study has also found more anatomical differences that could account for the difference in the strength of coordination between down states of the RTC and PFC with dorsal SWRs. Ferreira-Fernandes et al. (2019) used novel anatomical tracing tools to shed light on the different connectivity patterns between the hippocampus and the medial mesocortex, which includes the cortical regions from the RTC to the cingulate cortex (CGC). The study found that the hippocampal projections into the medial mesocortex exhibit a gradient-like connectivity pattern (Ferreira-Fernandes et al. 2019). Specifically, the RTC has denser projections and stronger connectivity between the dorsal and intermediate CA1 compared with the prefrontal areas, which reinforces our observation that anatomical and circuit differences are responsible for the stronger coordination between down states in the RTC and SWRs/replays in the dorsal CA1. However, the consistency of this interaction is not always reliable, and an SWR does not always end up finishing an up state. It is important to discuss that it is possible that other brain circuits, such as the thalamus, may be required to be included in this process to increase the probability of this coordination (Tomé et al. 2022). In addition, an alternative hypothesis could be that SWRs and replays, such as those that propagate along the hippocampal longitudinal axis, may have a stronger impact on cortical down states of the RTC or PFC during certain memory-related processes, particularly during the reactivation of long and extended experiences (Davidson et al. 2009; Yamamoto and Tonegawa 2017). In support of this idea, studies have shown that long SWRs in the hippocampus, which involve more neurons representing task-relevant information, are critical for learning and memory (Fernández-Ruiz et al. 2019; Ngo et al. 2020). This could indicate that the hippocampus may enhance the coordination of multiple cortical regions by increasing the likelihood of down states, particularly during prolonged experiences when many neurons are recruited. This mechanism could play an essential role in consolidation and requires further investigation.
Cortical state coordination with hippocampal reactivation during SWS
Cortico–hippocampal interactions are essential for memory consolidation, and we were able to demonstrate for the first time that the coordination of both SWRs and replays with the cortical states of the RTC and PFC is highly specific and well coordinated. We were intrigued by the previously overlooked connection between SWRs and cortical up-to-down transitions in sleep studies. Here, we have shown that memory reactivation related to the exploration of a familiar environment occurs in close proximity to a cortical down state of the PFC or RTC ∼20%–30% of the time. This strong correlation left us wondering why the hippocampus would influence the transition of the cortex to the down state after memory reactivation. The current evidence related to cortical down states and their relationship with SWR/replays is somewhat controversial.
Earlier research has shown that during wakefulness, down states, also known as “microsleep” periods, occur more frequently when there is poorer behavioral performance (Vyazovskiy et al. 2011). Recent studies have supported this finding and have used advanced closed-loop technology to investigate the relationship between down states and SWRs during behavior. In particular, these studies have shown that inhibiting the prefrontal cortex after the detection of an SWR can have negative effects on performance (Peyrache et al. 2009; den Bakker et al. 2023). These findings suggest that during wakefulness, the cortical down state that follows a hippocampal SWR may be inversely related to memory formation. In contrast, other studies have suggested that SWRs and down state interactions during sleep could play a vital role in memory stabilization. For instance, Maingret et al. (2016) demonstrated for the first time that increasing the coordination of SWRs with cortical down states in the prefrontal cortex through electrical stimulation during sleep can improve memory consolidation in a spatial object task. Furthermore, Todorova and Zugaro (2019) found that a small population of cortical neurons activated during cortical down states formed cell assemblies with SWR-activated neurons during sleep. They proposed that the inhibitory action from cortical down states can be used to reduce nonrelevant information during cell assembly formation, as the cells that were correlated with SWRs were selectively modulated during the task. In addition, a recent study by Kim et al. (2023) found evidence that cortical down states in the motor and PFC, together with hippocampal SWRs, increase their coupling during learning and disengage during adaptation. This has been proposed as a mechanism that supports the dual-stage hypothesis for memory consolidation, where cross-brain region coupling via SOs with SWRs is essential for the early stage of memory consolidation.
In accordance with these studies, we reason that the coordination between replays and down states during the transition from up to down in cortical regions could serve multiple roles in sleep-dependent memory processes, such as consolidation. Replays have traditionally been regarded as an information transfer mechanism that, in conjunction with cortical activity, establishes neuronal ensembles between cortical–hippocampal modules (Rothschild et al. 2017; Kaefer et al. 2022). However, our data indicate that hippocampal reactivation can also facilitate cortical down states. This effect is observed locally, with certain cortical regions being more strongly modulated by SWRs than others. Consequently, the hippocampus may possess the flexibility to selectively engage specific cortical regions during memory processes where particular types of information are required. It is worth noting that our study identified a similar coordinated dynamic between replays associated with a familiar task and the overall population of SWRs. Nevertheless, we believe that this dynamic may vary depending on the type of information being processed or the specific cortical regions that the hippocampus needs to engage. Thus, it remains unknown whether hippocampal reactivation exhibits a bias toward certain cortical state configurations during distinct stages of memory formation. As a result, we anticipate that our study will inspire further investigation into the intricate dynamics of hippocampal reactivation and its relationship with cortical states. Collectively, we propose the hypothesis that the excitatory effect resulting from hippocampal memory reactivation is indispensable for the formation of memory ensembles between cortical–hippocampal regions. Furthermore, when this reactivation is accompanied by the modulation of down states during SWS, it may augment the hippocampus's flexibility to selectively coordinate brain regions or diminish memory interference.
Materials and Methods
Mice
We used male C57BL/6J mice (n = 9; 25–32 g; 12–16 wk old at the time of surgery for drive implantation) purchased from Jackson Laboratories. After drive implantation, mice were singly housed in a temperature-controlled room with standard mouse cages (29 × 19 × 12.7 cm) that contained bedding (EcoBedding and nestlets) on a 12-h light–dark cycle (lights on/off at 7:00 a.m./7:00 p.m.) with ad libitum access to water and food. All experiments were approved by the Committee on Animal Care at the Massachusetts Institute of Technology and conformed to National Institutes of Health guidelines for the care and use of laboratory animals.
Surgical drive implantation and electrophysiology recordings
Multielectrode arrays (microdrives) with up to 16 nichrome wire tetrodes (individual tetrode wires were 12.5 µm in diameter) were used. The microdrives were prepared according to standard procedures in the laboratory, and the base was modified from previous designs (Davidson et al. 2009; Nguyen et al. 2009) to target the three regions of interest. Because replay recordings require many units, we placed 10 tetrodes in dorsal CA1, three tetrodes in the RTC, and three tetrodes in the PFC and used the common average referencing (CAR) plug-in from Open-Ephys software as a reference for all recordings. To ensure a balanced representation of CAR signal and prevent dominance by any single region, channels from all three sites were included and any damaged channels were removed before generating CAR. The tetrodes spanned the following coordinates (Franklin and Paxinos 2008): Bregma +2.3–0.5 mm medial/lateral for mPFC, Bregma −1.7 to 0.5 mm medial/lateral for RTC, and Bregma −1.7 to 2.0 mm to 1–1.75 mm medial/lateral for dorsal CA1.
Sterile surgical procedures were performed for chronic microdrive implantation; anesthesia was induced and maintained with 1%–2% inhaled isoflurane. Up to four bone screws were secured to the skull for support. Two craniotomies were drilled over the target coordinates, and the dura mater membrane was removed to allow tetrode penetration. The implant was secured to the skull with dental cement after surrounding the exposed craniotomies and tetrodes with silicon grease to prevent them from being fixed by the cement. Animals were preemptively injected with analgesics (0.5–1 mg/kg buprenorphine, subcutaneous) and monitored by the experimenter and veterinarian staff for 3 d after surgery.
The tetrodes were gradually advanced to the target depths over the course of 1 wk before recording started. Once the target depth was reached, minimal adjustments (≈25- to 50-µm movement) were made the night before to guaranty the recording from different populations of cells and the stability of unit and local field potential (LFP) recordings. Sleep recording sessions typically lasted at least 1.5 h, while behavior and sleep recordings took ∼3–4 h. All sleep recordings were made in a home cage surrounded by walls preventing mice from accessing visual cues.
Spikes and LFPs were acquired at 30 kHz using Intan Technologies RHD-64 recording head stage with a 64-channel amplifier chip and Open-Ephys GUI (https://open-ephys.github.io/gui-docs/index.html). Units were detected and isolated using kilosort2.0 (https://github.com/MouseLand/Kilosort/releases/tag/v2.0) and Phy GUI (https://github.com/cortex-lab/phy). LFPs were downsampled to 1 kHz from up to 30 kHz using the Matlab downsample function. DeepLabCut (https://github.com/DeepLabCut/DeepLabCut) was used to track the mouse position and estimate velocity.
LFP and event state detection
For each mouse, we selected one wire from one or both cortical regions with clear sleep events (determined by visual inspection) and used one to two tetrodes. These selections were made for LFP/unit sleep analyses. To analyze cortical and hippocampal oscillations, we used two LFPs from each region (CA1, the RTC, and the PFC). We applied a bandpass finite impulse response filter designed with a Blackman window to filter the signals in the delta (1- to 4-Hz), spindle (7- to 16-Hz), ripple (125- to 250-Hz), or high-frequency (100- to 500-Hz) bands. Zero-phase distortion was ensured during the filtering process.
Sleep periods were identified as regions characterized by a high ratio of delta/theta power and immobility (velocity <1.5 cm/sec) (Supplemental Fig. S2D). The threshold for analyzing sleep periods was determined by examining the bimodal distribution of delta/theta power, which distinguished between awake and sleep states. Subsequently, various analyses such as replays, sharp wave ripple (SWR) detection, up/down states, and shuffle analysis were conducted specifically on the detected sleep periods. Any events detected outside these sleep periods were excluded from the analysis.
SWR events were detected using the Hilbert transform from the filtered ripple band. A 25-msec Gaussian smoothing filter (Matlab smoothdata function) was applied to the filtered signal, and a threshold of three standard deviations from the mean was used to identify candidate events. For an event to be considered as an SWR event, it had to meet the criteria of having a duration of >25 msec and <500 msec, with an interval of >25 msec.
Cortical up/down states were detected using a method similar to that described by Ji and Wilson (2007). The method involved analyzing the bimodal distribution of the multiunit activity (MUA) or MUA envelope (MUAe) obtained from the high-frequency (100- to 500-Hz) filtered signal of the cortical tetrodes’ local field potentials (LFPs) (Supplemental Fig. S1). To derive the MUAe, we applied the Hilbert transform to the high-frequency band of the LFPs in the RTC and PFC and smoothed the signal using a Gaussian filter with a 25-msec time window. The use of the MUAe had been helpful in previous studies when dealing with challenging clustering or spike detection scenarios (Choi et al. 2010; Ahmadi et al. 2021). The high-frequency component of the LFP is a reliable indicator of ionic conductivity from cortical activity and can be useful in detecting up/down states, as demonstrated in Supplemental Figure S2, C1 and C2 (Reimann et al. 2013). Only cortical up/down states during sleeping periods (high delta power) were included in the analysis. For our study, we defined a cortical up state as a period of cortical activity represented by MUA or an MUAe that lasted >100 msec but <1 sec. Conversely, a cortical down state was defined as a period of low/no cortical activity in the MUA and MUAe that lasted >50 msec but <500 msec. It is worth noting that our definition of cortical up/down states aligned with previous reports (Karalis and Sirota 2022).
Cortical state classification
To classify the cortical state during SWR replays, we started by obtaining the peak amplitude from the ripple band Hilbert transform of the SWR or the peak amplitude of the CA1 MUA for replay classification. This served as the reference point, and we extended it to 100 msec before and after, creating a total time window of 200 msec. For classification, we calculated the median of a 70-msec time window before (−200 to −130 msec), during (−35 to 35 msec), and after (130–200 msec) the MUA or MUAe from the RTC and PFC. This resulted in a matrix size of three by the number of ripple/replay events. To determine the cortical state, we compared the calculated median with a threshold. If the median was below the threshold, it was classified as a down state region. Conversely, if the median was above the threshold, it was classified as an up state region. Figure 2 illustrates the classification results for each configuration. In Supplemental Figure S4, we present the uncategorized SWRs that occurred between cortical up states (Supplemental Fig. S3A1,B1,B2) or down states (Supplemental Fig. S4A2,C1,C2). However, due to the duration of the up and down states being on average <50 msec, these events were faster than delta oscillations. Consequently, it became challenging to ascertain whether they represented typical up or down states. As a result, we made the decision not to include them in our analysis. The fraction of cortical SWR/replay state classification was calculated by dividing the number of classifications by the total number of SWR/replay events, including the uncategorized ones.
Delta phase distribution for SWRs and down states
The phase of the delta wave for the RTC and PFC was estimated using the Hilbert transform from the delta band during periods of high delta power (sleeping periods). We obtained the time stamp from the SWR peak amplitude and the onset of a cortical down state from the RTC and PFC to determine the delta angle for SWRs and down states. The average angle distribution and the Rayleigh test of uniformity were obtained using the Matlab functions CircHist (https://github.com/zifredder/CircHist) and CircStat (https://github.com/circstat/circstat-matlab). Only simultaneous triple recordings (CA1, the RTC, and the PFC) were included in this analysis.
Up and down state onset occurrence during SWRs
A perievent histogram for the onset of up and down states was obtained from a time window of 800 msec, where zero represented the SWR peak amplitude. The count of events was then z-scored using the Matlab function, which measures the distance of a data point from the mean in terms of the standard deviation. To estimate the z-scored amplitude, variance, and peak timing of the down state onsets, we used a time window of 0–200 msec and fitted a Gaussian curve using Matlab. To determine the up state onset amplitude, we calculated the maximum z-score values within a time window ranging from −200 to −150 msec before SWRs as well as from 150 to 200 msec after SWRs.
Neural decoding (position estimation) and replay detection
We conducted replay analysis using mice running in a linear maze measuring ∼200 cm. The mice were subjected to a mild food-restricted protocol (5–6 g of food/day), ensuring they did not lose weight during the running periods (5 d). They ran in the maze for ∼30 min and were then placed back in their home cage, which was devoid of visual cues, and their sleep was recorded for ∼1–2 h. To compute the joint probability distribution of position from neuronal firing activity, we used a Bayesian reconstruction algorithm described by Zhang et al. (1998) and Davidson et al. (2009). For each unit, we constructed a joint tuning curve based on the linearized position (with 4-cm bins) using all the spikes emitted during the running session (Fig. 5A1). To smooth the curve, we applied a Gaussian kernel with standard deviation of 6 cm. Interneurons with a mean firing rate >9 Hz were excluded from the analysis. To estimate the position, we computed the marginal distribution of these estimates over position using 80% of the data as “training data.” We then validated the estimation using run epochs, as illustrated in Figure 5, A2 and A3. During the testing period, we used the training models to estimate the position. To assess the reconstruction accuracy across the track, we calculated confusion matrices (Fig. 5A2) and compared the maximum likelihood estimates of position with the mouse's actual behavior to determine the median error (Fig. 5A3) for the model.
Once we developed a model capable of estimating the positions of mice with a median error accuracy of <20 cm, our next step was to identify potential replay candidate events. We achieved this by using a smoothed histogram constructed from the multiunit activity (MUA) of isolated unit clusters with 1-msec bins and a Gaussian kernel (SD = 25 msec) to smooth the signal. To detect candidate replay events, we applied a threshold of three standard deviations from the mean of the MUA. For an event to be classified as a replay candidate, it needed to last between 75 and 500 msec. We then binned the spikes from each candidate replay event at 5-msec intervals. Subsequently, we used decoding methods to estimate the position within each candidate event.
To qualify as a “replay,” a candidate event had to exhibit temporal trajectories demonstrating both linear and nonlinear statistical dependencies, as described by Liu et al. (2018). This involved fitting each event's spatial trajectory using a linear model (Davidson et al. 2009; Wu and Foster 2014) as well as a weighted distance correlations model (Liu et al. 2018). To validate the significance of each candidate event, we conducted a statistical test. This involved comparing the correlation of the candidate event with the correlation of shuffled spiking activity in three distinct directions (row, column, and both) using Monte Carlo simulations. For assessing replays, we provide the code at online at https://github.com/shizhaoliu/memory. Replays with a statistical P-value of <0.05 were included in the analysis.
Spatial navigation for replay analysis
Replay analysis was conducted on three animals (triple recordings, the RTC, the PFC, and CA1) as they navigated a familiar linear track spanning ∼2 m. Prior to recording, the animals underwent a habituation phase, spending 1 d (with 30-min sessions) in the linear track to acclimate freely. Following habituation, the animals were placed in the linear maze, where they had to run toward two points to receive a reward pellet. The running sessions lasted between 30 min and 1 h. After completion, the animals were provided with food in their sleeping cage/box, which lacked any visual cues. They remained in the cage until they had slept for at least 1 h. In total, the recordings consisted of a 15- to 30-min prerunning phase, a 30- to 60-min running behavior phase, and >1 h of postsleep recordings. This recording protocol was repeated for three to four consecutive days for each animal.
Statistical analysis
All statistical analyses were done using robust ANOVAs or t-tests with 20% trimmed means and bootstrap-t. The GitHub repository containing the code and data used to perform the statistical tests is available at https://github.com/410pfeliciano/data_replay_coordination_to_rtc_pfc_states/tree/main (see Mair and Wilcox 2020; Wilcox and Rousselet 2023).
Histology and tetrode localization
After completing the electrophysiological experiments, the mice were anesthetized using isoflurane until they were unresponsive to tail/toe pinches. Electrical currents were administered into each tetrode at 40 µA/tetrode for ∼20 sec. Subsequently, the mice were transcardially perfused with 30–40 mL of 1× PBS and then with 10% formalin at a rate of 1.3 mL/min until muscle contractions occurred. The brains were stored in 10% formalin for a minimum of 24 h before being sectioned using a vibratome. Coronal sections with a thickness of 50 µm were collected to ensure the accurate placement of all tetrodes.
Acknowledgments
These experiments were funded by National Institutes of Health grants R01MH118928 (to M.W.), F32NS100356 (to P.A.F.-R.), and NINDS-R01 NS128106-01 (to M.G.), as well as a Picower Junior Faculty Development Program fellowship and a National Alliance for Research on Schizophrenia and Depression Young Investigator award from Brain and Behavior Foundation (to M.G.).
Footnotes
-
[Supplemental material is available for this article.]
-
Article is online at http://www.learnmem.org/cgi/doi/10.1101/lm.053834.123.
- Received June 12, 2023.
- Accepted August 25, 2023.
This article is distributed exclusively by Cold Spring Harbor Laboratory Press for the first 12 months after the full-issue publication date (see http://learnmem.cshlp.org/site/misc/terms.xhtml). After 12 months, it is available under a Creative Commons License (Attribution-NonCommercial 4.0 International), as described at http://creativecommons.org/licenses/by-nc/4.0/.



