


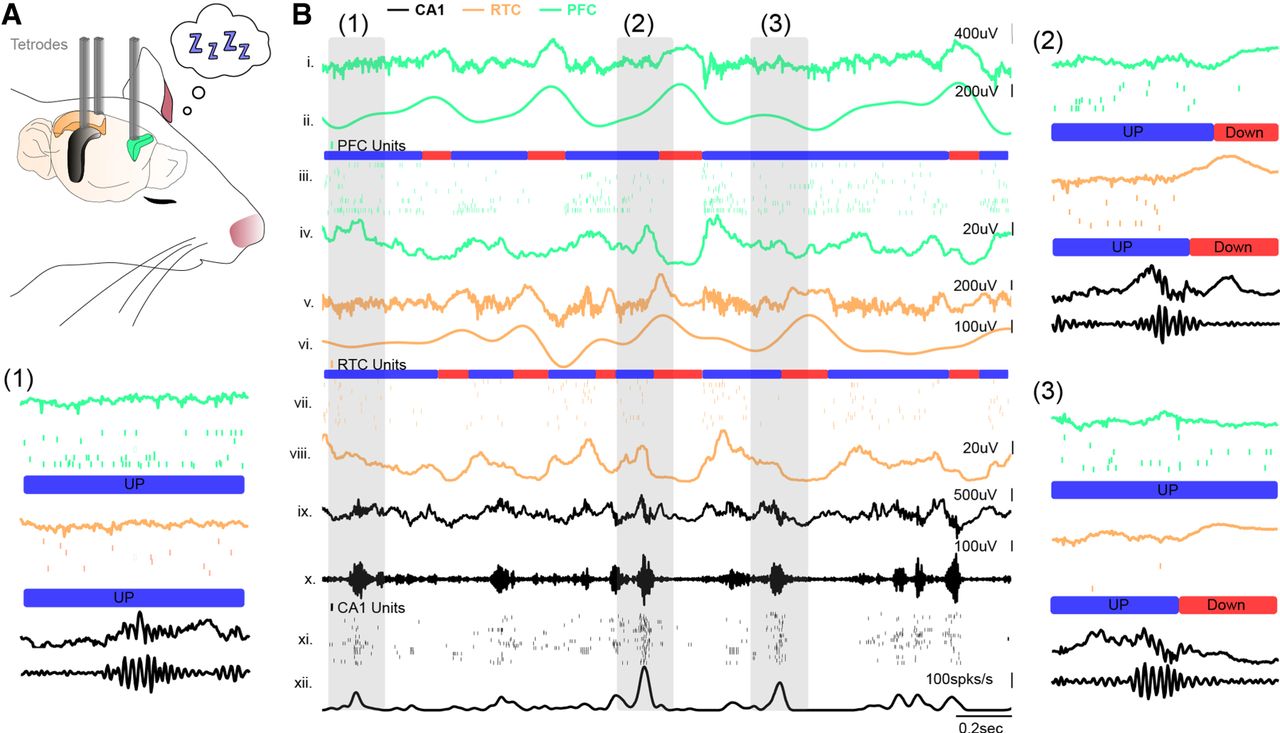
Dynamic coordination of cortico–hippocampal activity during slow-wave sleep (SWS). (A) Simultaneous extracellular recordings were made in the hippocampal CA1 (black), retrosplenial cortex (RTC), and prefrontal cortex (PFC) during the sleep of freely behaving animals. Tetrodes (gray) were placed using one of the three configurations: CA1–PFC, CA1–RTC, or CA1–RTC–PFC. The black area in this illustration corresponds to the hippocampal CA1, the orange region corresponds to the RTC, and the green region corresponds to the prefrontal cortex. (B) An example of a simultaneous triple extracellular recording between the CA1, RTC, and PFC. (Panels i–iv) The PFC raw local field potential (LFP), filtered delta (1–4 Hz), units, and multiunit envelope (high-pass filter > 500 Hz). (Panels v–viii) The RTC raw LFP, filtered delta (1–4 Hz), units, and multiunit envelope (high-pass filter > 500 Hz). (Panels ix–xii) The CA1 raw LFP, filtered ripple (125–250 Hz), units, and multiunit activity (MUA). The up (blue) and down (red) state periods in the RTC and PFC are illustrated. (Panel 1) An example of a CA1 sharp-wave ripple (SWR) occurring during cortical activity. (Panel 2) An example of a CA1 SWR occurring close to a down state region in the PFC and RTC. (Panel 3) An example of a CA1 SWR occurring close to an RTC down state while PFC was in an up cortical state.



