


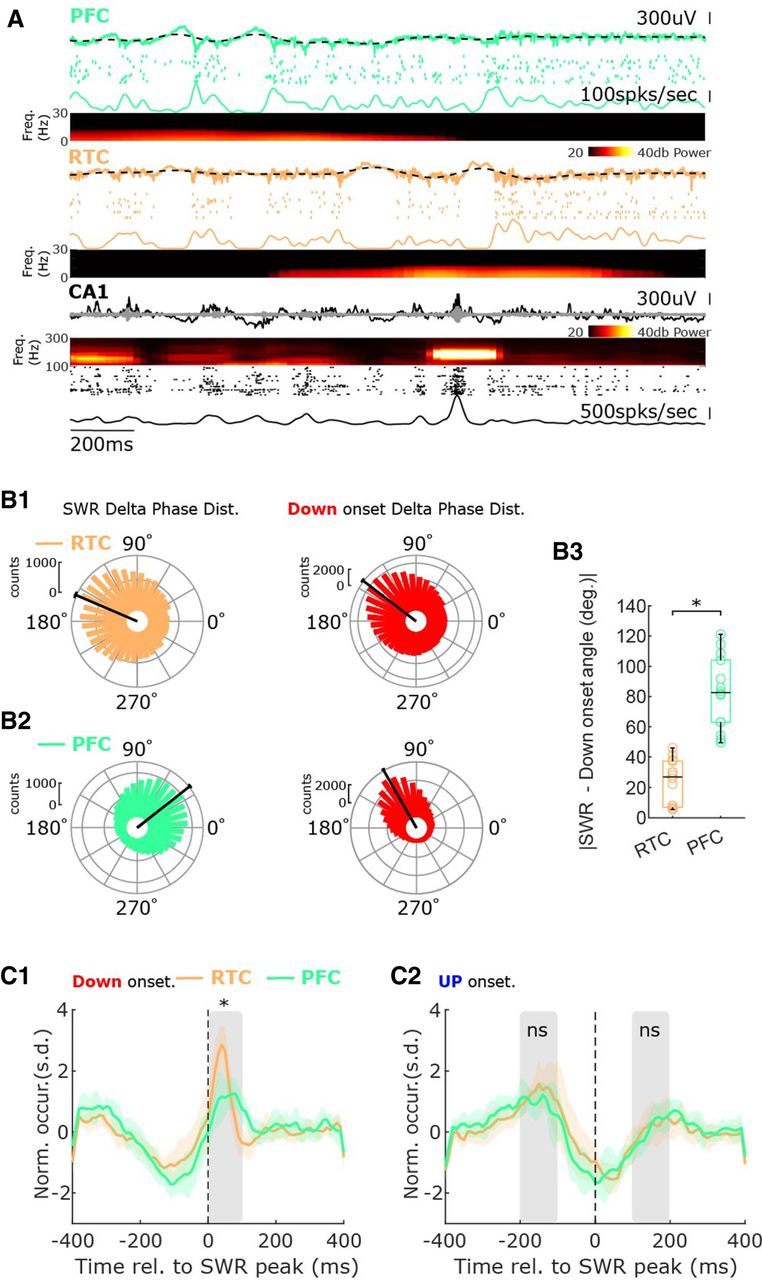
SWR and down state delta phase distributions and up/down state onset perievent time histograms. (A) An example of a simultaneous triple extracellular recording between the CA1, RTC, and PFC. The PFC raw local field potential (LFP), filtered delta (1–4 Hz black), units, MUA firing rate, and spectrogram. The RTC raw LFP, filtered delta (1–4 Hz black), units, MUA firing rate, and spectrogram. CA1 raw LFP, filtered ripples (125–300 Hz gray), spectrogram, units, and MUA. (B1–B3) SWR and down state delta phase distributions. (B1) RTC SWR (orange) and down state (red) delta phase distributions. Four mice, n = 14. (B2) SWR and down state delta phase distributions. (B2) PFC SWR (green) and down state (red) delta phase distributions. Four mice, n = 14. (B3) The absolute value of the difference between the delta phase average from SWRs and the down state onsets from the RTC or PFC. (C1,C2) Perievent time histograms for the RTC and PFC down (C1) and up (C2) state onsets during SWRs. (*) P < 0.01, (ns) P > 0.05. Only simultaneous triple recordings were included in the analysis.



