


Specific behaviors during auditory fear conditioning and postsynaptic expression of AMPA receptors in the basolateral amygdala predict interindividual differences in fear generalization in male rats
- 1Programa Graduado em Áreas da Biologia Básica e Aplicada (GABBA), Instituto de Ciências Biomédicas Abel Salazar, Universidade do Porto, Porto 4050-313, Portugal
- 2Department of Psychology, McGill University, Montreal, Quebec H3A 1G1, Canada
- 3the Simons Initiative for the Developing Brain, the Patrick Wild Centre, the University of Edinburgh, Edinburgh EH8 9XD, United Kingdom
- Corresponding author: oliver.hardt{at}mcgill.ca
Abstract
Auditory fear conditioning in rats is a widely used method to study learning, memory, and emotional responding. Despite procedural standardizations and optimizations, there is substantial interindividual variability in fear expression during test, notably in terms of fear expressed toward the testing context alone. To better understand which factors could explain this variation between subjects, we here explored whether behavior during training and expression of AMPA receptors (AMPARs) after long-term memory formation in the amygdala could predict freezing during test. We studied outbred male rats and found strong variation in fear generalization to a different context. Hierarchical clustering of these data identified two distinct groups of subjects that independently correlated with a specific pattern of behaviors expressed during initial training (i.e., rearing and freezing). The extent of fear generalization correlated positively with postsynaptic expression of GluA1-containing AMPA receptors in the basolateral nucleus of the amygdala. Our data thus identify candidate behavioral and molecular predictors of fear generalization that may inform our understanding of some anxiety-related disorders, such as posttraumatic stress disorder (PTSD), that are characterized by overgeneralized fear.
Fear expression of rats in auditory fear conditioning (AFC) usually varies across an experimental cohort even though all individuals have been exposed to the same stimulus type, display little intraspecific genetic variation, and have experienced similar controlled, uniform living conditions. Fear is usually assessed by measuring freezing, the canonical behavioral response in these tasks. While rats express freezing in a variety of natural situations and often as just one response among others to threat, in experimental procedures in laboratory settings it is the typical behavioral response when flight or attack do not effectively diffuse the perceived threat, as is the case in most auditory fear conditioning protocols where footshock cannot be escaped. A common observation in these laboratory tasks is that the same fear conditioning training protocol gives rise to broad variance of fear expression during subsequent retrieval or extinction. For example, rats may present anywhere between fast and slow reduction of freezing, and some rats may even show no extinction at all after 20 extinction sessions (Galatzer-Levy et al. 2013).
Such variations in the freezing response may not be entirely random and could reflect to some extent intervening organismic variables. For example, different mRNA profiles of principal neurons in the rat nucleus accumbens correlate with individual differences in addiction-like behavior (Imperio et al. 2016). Similarly, interindividual variations in stress-related responses have been linked to individual differences in the expression of fear and anxiety (Kazlauckas et al. 2005; Bush et al. 2007; Walker et al. 2008; Shumake et al. 2014). Analogous parameters also influence conditioned fear memory, leading, for example, to differences in overall levels of freezing or in the extent of generalized fear (Rudy and Pugh 1996; Baldi et al. 2004), which the intensity of the CS and the number of conditioning trials can moderate (Desiderato 1964).
Another source accounting for variance in this fear response may arise from behaviors other than freezing that animals express in these tasks. For example, placing a novel object into a previously explored open field can result in both low and high exploratory activity in mice, which can predict their level of anxiety expressed in an elevated plus maze (Kazlauckas et al. 2005). In AFC, candidate behaviors that might help explain variance in freezing are grooming and rearing. While grooming has generated some contradictory results in predicting fear expression (e.g., Reimer et al. 2015), it has been shown that rodents express rearing when their fear is low (Gray and McNaughton 2000). Rearing is part of the exploratory behavior rodents exhibit when acquiring spatial–contextual memories. Low rearing in stressful situations therefore could indicate that animals sample the environment less, resulting in spatial–contextual knowledge insufficient for accurate context discrimination. This in turn could lead, for example, to higher generalization of contextual fear.
While some degree of fear generalization is adaptive, alerting animals to threats resembling previously encountered ones, excessive generalization can promote anxiety in otherwise safe environments (Xu and Sudhof 2013). Cued fear memory is known to generalize over time, and in AFC this process involves the interplay between the medial geniculate nucleus (MgN) of the thalamus and the amygdala (Ferrara et al. 2017). The amygdala is critically implicated in fear memory and expression, and its basolateral (BLA) nucleus contributes to the ability to discriminate between aversive and nonaversive stimuli (Tovote et al. 2015). Different populations of neurons within the BLA encode generalized and cue-specific associations (Ghosh and Chattarji 2015; Grosso et al. 2018). Interestingly, increased neuronal activity in the BLA has been shown to promote fear generalization (Rajbhandari et al. 2016; Ferrara et al. 2017). Most excitatory transmission in the mammalian brain is mediated by AMPA receptors (AMPARs), ionotropic channels that are differentially composed of four subunits (GluA1–4). The expression of the GluA1 subunit, in particular, increases in the rat amygdala during fear memory consolidation (Hong et al. 2013). Thus, interindividual differences in GluA1 expression in the BLA might account for differences in fear generalization.
Here, we used a standard AFC protocol to seek out variables that may explain differences in fear responding. We trained male rats with two tone–shock (conditioned stimulus [CS] and unconditioned stimulus [US]) pairings. When testing the response to the CS in a familiar testing context (context A) different from the training context (context B), we observed a wide range of freezing to the known testing context alone (assessed as pre-CS freezing), which is a common outcome of this standardized procedure. The rats, however, had not expressed generalized fear during initial exposure to the training context before they had experienced the first tone–shock pairing, therefore making the generalization during test an outcome of fear conditioning. To identify possible behavioral and biochemical predictors of this generalization, we used correlational and cluster analysis on several behavior parameters, as well as measurement of AMPAR expression at BLA synapses. We found that low rearing and high freezing during fear conditioning, as well as increased expression of GluA1-containing AMPARs in the BLA, significantly predicted generalized fear to the familiar testing context.
Results
Broad range of pre-CS freezing responses during the fear memory test
We conducted a standard auditory fear conditioning protocol consisting of three consecutive days of habituation to the testing context (context A), then 1 d later an auditory fear conditioning session (context B), and finally on the next day a long-term retention test (context A) (Fig. 1A). During test, animals were allowed to explore the box for 2 min (pre-CS phase), followed by presentation of a 4-kHz tone for 30 sec (CS phase). We measured freezing duration over both phases. Based on previous findings of others indicating an average baseline of freezing >20% (e.g., see Watson et al. 2016), as well as our current results showing that animals displayed on average 0.9% freezing during the 2-min “pre” training phase, we set the baseline freezing threshold to 10% for our analyses. Because both pre-CS and CS variables seem to be inconsistent with a Gaussian distribution (D'Agostino and Pearson omnibus K2 test: pre-CS, K2 = 8.19, P = 0.0166; CS, K2 = 6.38, P = 0.0412) (see also Supplemental Table S2), we analyzed behavior during test using a Wilcoxon matched-pairs signed rank test and detected a significant effect (pre-CS vs. CS, W = 262, P < 0.001) (Fig. 1B). However, we noticed that the coefficient of variation was almost three times higher for pre-CS (116.5%) when compared with CS (41.17%) phase. Indeed, pre-CS freezing responses varied considerably, with >60% of the animals freezing >10% of the 2-min pre-CS phase time (Fig. 1C). We did not find such variation in freezing to the context prior to the first shock for the training session (average pre < 1%; only one animal froze >10% of the 2-min pre-CS phase—namely, 12.3%) (Fig. 1D). Thus, animals did not present with pre-existing fear to a novel context (context B), and following auditory fear conditioning, a considerable number of animals generalized their fear to a known context (context A).
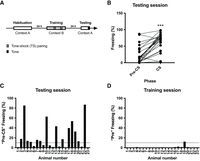
Wide range of fear responses to the testing context following fear conditioning. (A) Schematic representation of the experiment. Animals were habituated to context A for 3 d (5 min/day), received two tone–shock pairings in context B, and were tested by presenting the tone without shock in context A 24 h later. (B) Average individual freezing before (pre-CS) and during (CS) tone presentation during the testing session. Wilcoxon matched-pairs signed rank test: pre-CS versus CS, W = 262. (***) P < 0.001. (C) During the 2 min preceding presentation of the tone (pre-CS phase) in context A, there was an overall unexpected widening of fear responses to the context. Horizontal dashed lines indicate cutoff at 10%. (D) Freezing (in percentage) to context B before the first tone–shock pairing (Pre phase) at the training session was minimal. Same cutoff as in C is indicated.
Canonical analysis suggests that characteristic training behaviors do not predict fear generalization
To identify behavioral characteristics observed in the training session that could predict the generalized fear to the test context (context A), we considered three well-characterized and easily identifiable behaviors in the rat—freezing, rearing, and grooming (Cain and LeDoux 2007)—for which we measured duration in seconds and bout number and calculated average bout duration in seconds per bout (Fig. 2A). Expression of these behaviors during the training session varied across phase transitions (Fig. 2B–H), including “Pre” (before conditioning), “TS1” (first tone–shock presentation), “ITI” (intertrial interval), “TS2” (second tone–shock presentation), and “Post” (final phase following conditioning). Because each phase had a different duration (Fig. 2A), direct comparison between phases was not possible without normalization, and this is only plausible for duration measurements, not number of bouts. We therefore transformed training parameter phase durations (in seconds) into phase percentages for grooming, freezing, and rearing (Fig. 2B–D, gray traces). Because only freezing “Post” (K2 = 3.38, P = 0.184), rearing “Pre” (K2 = 1.25, P = 0.536), “TS1” (K2 = 1.65, P = 0.438), “ITI” (K2 = 4.32, P = 0.115), and grooming “Pre” (K2 = 1.16, P = 0.560) were normally distributed (D'Agostino and Pearson omnibus K2 normality test), we performed a nonparametric Friedman's test on each transformed parameter with phase (Pre vs. TS1 vs. ITI vs. TS2 vs. Post) as repeated factor, as well as a related-samples Kendall's coefficient of concordance test for effect size evaluation. The test detected a significant [freezing, χ(4)2 = 34.64, P < 0.001; rearing, χ(4)2 = 39.85, P < 0.001; grooming, χ(4)2 = 32.83, P < 0.001] and moderate (freezing, W = 0.377; rearing, W = 0.433; grooming, W = 0.357) effect size of phase for each measure, while post-hoc Dunn–Bonferroni analyses confirmed within-phase differences (Fig. 2B–D, gray traces). We next explored whether any of the behavioral parameters or a combination of these could explain variability of pre-CS freezing (overall duration in seconds, absolute bout frequency, and average bout duration in seconds per bout). Because only 15 of the 41 training parameters (∼37%) were normally distributed (assessed via D'Agostino and Pearson omnibus K2 normality test) (see Supplemental Tables S1, S2), we used both parametric (Pearson) and nonparametric (Spearman) correlational analyses, along with graphical inspection of variable relationships. Within the 40 possible Pearson correlation tests between test session pre-CS parameters and each of the other training and test behavioral data (Supplemental Tables S3–S5), our analysis detected no linear relationships (P > 0.05) when comparing training session parameters against the total duration of pre-CS freezing during test and the average duration of pre-CS freezing bouts. We detected medium-sized linear correlations between pre-CS freezing bout frequency during test and (1) the average ITI freezing bout duration, (2) the average TS2 freezing bout duration, (3) the total duration of rearing during Pre, and (4) the average Post rearing bout duration (0.17 < r2 < 0.22) (summary in Table 1; Fig. 3). On the other hand, nonparametric analysis indicated that seven training behavior variables displayed a monotonic relationship to at least one of the three test pre-CS freezing measurements (see Supplemental Tables S6–S8). However, these Spearman correlations generally did not follow readily identifiable linear or nonlinear functions, as the plots reveal (Supplemental Fig. S1), except for the duration of Pre rearing, which followed a weak linear relationship (Fig. 3C). Thus, there seems to be little potential in any single measure of the training behavior to overall predict the observed fear generalization upon re-exposure to the familiar testing chamber.
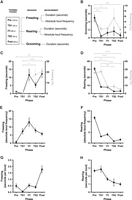
Behavioral profiles during fear memory conditioning. (A) We split the auditory fear conditioning session into five phases (“Pre”: before conditioning, “TS1”; first tone–shock presentation, “ITI”: intertrial interval, “TS2”: second tone–shock presentation, and “Post”: after conditioning) with different durations (in seconds) and measured for each phase both absolute bout frequency and time spent freezing and rearing, as well as time spent grooming. (B–H) Behavior profiles included time spent grooming (B), freezing (C), and rearing (D); absolute bout frequency of freezing (E) and rearing (F); and average bout duration of freezing (G) and rearing (H). Freezing, rearing, and grooming were recalculated as phase percentage for phase comparison (gray traces in B–D). For the latter we ran a Friedman's test with Dunn–Bonferroni multiple comparisons test as post-hoc analysis. (*) P < 0.05, (**) P < 0.01, (***) P < 0.001. All data points represent mean ± 1 SEM.
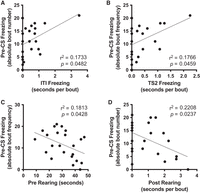
Training parameters poorly predict pre-CS freezing during test. Only four out of 120 Pearson correlations were statistically significant. Training ITI freezing (A), TS2 freezing (B), and Post rearing (D) average bout duration (in seconds per bout), as well as Pre rearing duration (in seconds) (C) linearly correlated with testing absolute bout frequency of freezing parameter during pre-CS phase. Squared Pearson coefficient (r2) and P-value indicate that only between 17% and 23% of the pre-CS freezing bouts during testing can be explained by any one of these four training parameters.
Summary of significant (P < 0.05) correlations between the indicated training phase parameters and “pre-CS freezing absolute bout frequency” (see Fig. 3)
Cluster analysis reveals a high-anxiety profile predictive of fear generalization
Although correlation analysis failed to detect suitable predictors for generalization of fear to a known context for our experimental protocol, we explored whether considering all training phases (Pre, TS1, ITI, TS2, and Post) simultaneously for each animal might reveal a training behavior profile predictive of pre-CS freezing during test. To address this possibility, we performed a hierarchical cluster analysis (detailed in the Materials and Methods). Proximity matrix and agglomeration schedule cross-analyses (see Supplemental Tables S9, S10), together with visual inspection of a coefficient scree plot (Fig. 4A) and the clustering dendrogram (Fig. 4B), pointed to two major clusters: one with size n = 16 (cluster 1 [C1]) and one with size n = 7 (cluster 2 [C2]) (Fig. 4C,D). Given the group split, we reanalyzed normality of training parameters for each new set, which had doubled from 41 to 82 parameters. Because the D'Agostino and Pearson omnibus K2 test is only valid for 20 ≤ n ≤ 200 (before clustering, n = 23) (D'Agostino and Pearson 1973), we assessed normality of C1 and C2 data using the Shapiro–Wilk W statistic, which can accommodate smaller sample sizes (3 ≤ n ≤ 50) (D'Agostino and Pearson 1973). We found that only 39 parameters—12 from C1 (∼14.6%) and 27 from C2 (∼32.9%) —were normally distributed (see Supplemental Tables S11–S14), still leaving out a large set that is not (∼52.4%). Ideally a nonparametric two-way mixed ANOVA-like analysis based on these two clusters as between-subject factor (C1 vs. C2) and on training phase (Pre vs. TS1 vs. ITI vs. TS2 vs. Post) as the repeated factor should be carried out. However, nonparametric procedures with more than one factor are not generally acceptable (Zar 2014) and Friedman's test is only suited for a single repeated factor. We therefore decided to use two-sample t-tests (comparing C1 vs. C2) for pairs of normally distributed samples, and nonparametric Mann–Whitney U-tests (comparing C1 vs. C2) for pairs where at least one variable was not normally distributed (see Supplemental Table S15). There were significant differences between C1 and C2 for only eight (19.5%) of the 41 parameters. Student's t-tests revealed significant differences between the clusters for ITI rearing duration (t(19.81) = 3.664, P = 0.002) and absolute bout number (t(20.78) = 3.583, P = 0.002) during training, as well as for CS freezing absolute bout number (t(17.67) = 5.277, P < 0.001) during testing; Mann–Whitney U-tests detected significant differences between the clusters for TS2 freezing duration (U = 23.0, z = −2.336, P = 0.019) and average bout duration (U = 26.0, z = −2.123, P = 0.034) during training, as well as for pre-CS freezing duration (U = 0.0, z = −3.743, P < 0.001), pre-CS (U = 0.0, z = −3.743, P < 0.001), and CS (U = 2.0, z = −3.608, P < 0.001) freezing average bout duration during testing. Most importantly, the two clusters differed numerically in freezing and rearing following the first shock during training (during ITI and TS2 phases) (Fig. 5), with cluster 1 displaying low freezing/high rearing and cluster 2 displaying high freezing/low rearing as predictors of low and high pre-CS freezing, respectively. These data suggest that fear generalization to the testing context (context A) is best predicted by the number of freezing and rearing bouts, their summed durations, and average bout durations occurring after the first CS–US pairing; that is, during the intertrial interval (ITI) and/or second tone presentation (TS2) of the training session in context B. However, this relationship is neither linear nor exclusive given the correlation analysis data above, indicating a behavioral bifurcation (mostly high freezing/low rearing vs. mostly low freezing/high rearing) instead of a continuous, intermixed freezing/rearing gradient.
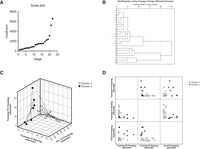
Hierarchical cluster analysis produces two major clusters of animals. We analyzed dependent variables freezing, rearing, and grooming duration (in seconds) for all training phases (Pre, TS1, ITI, TS2, and Post) and freezing duration for both testing phases (pre-CS and CS) for each rat. Here, we show a scree plot (A) taken from the agglomeration schedule (Supplemental Table S5) and a clustering dendrogram (B) indicating at least two meaningful clusters. (C) Freezing and rearing during the training ITI are the best predictors for pre-CS freezing during the test and thus are displayed labeled by cluster as a 3D scatter plot with cluster centroid spikes. (D) Providing more detail, these data also are presented as a 2D matrix plot.
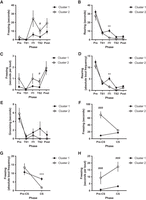
High freezing and low rearing after first shock presentation predict fear generalization during test. Displayed are behavioral profiles of animals in clusters 1 and 2 for time (in seconds) spent freezing (A), rearing (B), and grooming (E), as well as average bout duration (in seconds per bout) of freezing (C) and absolute bout frequency of rearing (D) during training. We also show freezing duration (F), absolute bout frequency (G), and average bout duration (H) during test. We performed two-sample hypothesis testing using Student's t-test on parameters with normal distribution and Mann–Whitney U-test on nonnormal data (see Supplemental Table S15). Data points represent mean ± 1 SEM. Student's t-test: (**) P < 0.01, (***) P < 0.001; Mann–Whitney U-test: (#) P < 0.05, (###) P < 0.001.
Pre-CS freezing positively correlates with GluA1 expression at amygdala synapses
We tested whether the observed differences in individual pre-CS freezing levels could be explained by variations in native populations of AMPARs in the BLA (Fig. 6) and therefore measured their expression in postsynaptic densities (PSDs) and extrasynaptic regions (ESRs). We randomly selected six animals (n = 6) and correlated optical density measurements from the immunoblots directly with pre-CS freezing levels during test in context B. This revealed a highly significant covariation of freezing with synaptically expressed GluA1 (sGluA1, r2 = 0.9648, P < 0.001) but not extrasynaptically expressed GluA1, although we still detected a strong trend (eGluA1, r2 = 0.6217, P = 0.0624). There were no significant differences for expression of either synaptic (sGluA2) or extrasynaptic (eGluA2) GluA2 (Fig. 7). Post-hoc power analysis (Pearson Product-Moment tool in SPSS) resulted in high statistical power (0.995) for a sample size n = 6 and a Pearson correlation parameter r = 0.9822. These data indicate that the expressed levels of GluA1 in spines of the BLA relate to the degree of fear generalization observed in an animal.
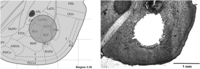
Amygdala punches for BLA tissue collection. In order to analyze the expression of AMPARs at amygdala synapses, we collected amygdala tissue from selected animals with a 1-mm hollow needle directed at the basolateral amygdala nuclei (BLA). Here we show a representative microscopy image of a rat brain slice after punching, illustrating that most of the tissue was collected from the BLA and lateral amygdala (LA) while sparing other nuclei, including the central (CeA) and the basomedial (BMA) nuclei.
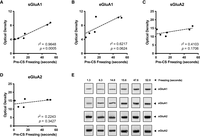
Synaptic GluA1 expression at the BLA correlates with fear generalization during testing. Differential centrifugation of BLA tissue taken from selected animals displaying varying degrees of testing pre-CS freezing yielded synaptic and extrasynaptic fractions containing PSD proteins. Quantification of these fractions via optical densitometry revealed dissimilar expression of synaptic (sGluA1 and sGluA2) (A,C) and extrasynaptic (eGluA1 and eGluA2) (B,D) AMPARs, with GluA1 showing the highest degree of linear correlation with pre-CS freezing duration (in seconds) during test. Squared Pearson coefficient (r2) and respective P-values are indicated as scatter plot insets. (E) Blots of all proteins analyzed on each fraction are shown, with pre-CS freezing levels displayed as phase percentage above the blots.
Discussion
We explored behavioral and synaptic markers in male rats that could account for individual differences in fear generalization to a testing context after auditory fear conditioning. Cluster analysis revealed that specific behavioral profiles observed during training predicted fear generalization. Specifically, we observed that animals jointly expressing high freezing and low rearing after the first tone–shock pairing presented also with high pre-CS freezing during test; that is, fear generalized to the testing context. Furthermore, postsynaptic GluA1-AMPAR levels at BLA synapses measured shortly after the test correlated with pre-CS freezing as well. These results suggest that learning during training may affect the extent to which animals generalize their auditory fear over time, depending on individual differences in glutamatergic drive in the BLA.
Of all variables measured, rearing during training appeared as the most useful predictor for later fear generalization. Although relatively little is known about the exact functions and learning outcomes of rearing in rats, one of its accepted purposes seems to be the gathering of spatial or contextual information to map the present environment, notably when rats recognize environmental novelty (Lever et al. 2006). Rearing can be affected by fear and anxiety, which modulate this exploratory behavior in a nonlinear fashion. One theoretical account argues that rats likely reduce rearing in novel environments when they experience low anxiety but very high fear; on the other hand, rearing will be readily expressed when some anxiety—or excitement—is present due to novelty but fear is low (Gray and McNaughton 2000). In other words, the more rats experience a new situation as threatful, the less they will rear, and consequently, the less spatial–contextual knowledge about the environment they likely will acquire. This may shed light on our finding that the less rats expressed rearing after they experienced the first shock, the more they generalized their freezing to a known context; these rats can be assumed to have explored the spatial environment less than others and thus arrived at less detailed, less precise representations of the chamber in which they received footshocks. When presented with the test context that somewhat resembled the original training context (e.g., due to similar materials and general dimensions but also due to the relative similarity of the events compared with their daily lives in the colony), they may have falsely recognized this chamber as the one in which they received the footshocks, thus expressing fear in the form of freezing in anticipation of a similar unpleasant experience. Rats also express other exploratory behaviors to encode the environment, such as sniffing, horizontal scanning, and moving around, and this may explain why some of the animals that displayed low rearing during the intertrial interval nevertheless showed relatively low generalized contextual fear (Fig. 4D). Regardless, our data strongly suggest that rearing relates to context encoding in a standard AFC protocol, and future experimental studies will be required to explore this effect further.
Because auditory fear conditioning and contextual fear conditioning involve somewhat different pathways in the brain, the first being relatively independent of the hippocampus compared with the latter (Phillips and LeDoux 1992; Zelikowsky et al. 2014), it is not surprising that presenting the CS prompted rats to freeze strongly during test but less so to the context alone. Indeed, while variations in hippocampal spatial encoding can account for different pre-CS freezing during test, plasticity in the amygdala also mediates the acquisition and expression of various emotional aspects of the overall fear memory (Zelikowsky et al. 2014). Although it has been shown that activity in the circuit connecting the anterior cingulate cortex (ACC) to both the ventral (vHC) (Cullen et al. 2015; Bian et al. 2019) and dorsal (dHC) hippocampus (Nagayoshi et al. 2022) promotes fear memory generalization, the amygdala is critical for fear discrimination during learning, receiving afferent signals from and relaying efferent signals to the auditory cortex as well as other brain structures, including the vHC (Bin Kim and Cho 2017). In particular, ACC and vHC projections to the BLA seem to control fear expressed in novel, nonthreatening environments, which is dependent on training intensity (ACC) or time (vHP) (Ortiz et al. 2019). Disruptions of these pathways may thus also be involved in fear generalization phenomena. Other pathways, including an interaction of the bed nucleus of the stria terminalis (BNST) and the amygdala, underpin generalization responses upon fear learning (Sullivan et al. 2004; Duvarci et al. 2009), while the medial prefrontal cortex (mPFC) and the nucleus reuniens (NR) attenuate this effect by fine-tuning the discrimination between different contexts (Xu and Sudhof 2013; Likhtik et al. 2014). Also, plasticity in the medial geniculate nucleus (MgN) of the thalamus, which inputs to the amygdala, seems to modulate encoding of fear memory discrimination (Ferrara et al. 2017). Moreover, the neural circuitry responsible for the execution of freezing involves amygdala central nucleus (CEA)-driven disinhibition of the ventrolateral periaqueductal gray (vlPAG), producing downstream characteristic body immobilization (Tovote et al. 2016).
Considering that the BLA has extensive connections to the CEA, it is not surprising that individual modulation differences in BLA activity produce opposite expression of freezing and rearing behaviors. This may partially explain our clustering data, which indicate that two distinct clusters with high freezing/low rearing during the intertrial intervals of the conditioning session predicted contextual fear generalization during the test session. Interestingly, during rearing episodes in mice, place cells in the HC stop firing, while a different subset of different pyramidal cells becomes activated (Barth et al. 2018). This might reflect that the animals are in the process of updating existing spatial representation. Because HC place cell firing patterns change following amygdala stimulation (Kim et al. 2012), the stability of spatial representation during context encoding may be compromised when there is amygdala-dependent emotional distress, such as during AFC, possibly contributing to generalized fear, impairing the acquisition of comprehensive spatial representations of the environment.
Whether the amygdala directly or indirectly influences the HC is still a matter of debate; our findings, however, suggest findings suggest a possible scenario explaining why increased fear generalization in terms of pre-CS freezing correlated with less rearing during conditioning and higher GluA1 expression in BLA neurons in our studies: Possibly, for rats that reacted with a stronger fear response during auditory fear conditioning, activation in the amygdala was more pronounced, which in turn attenuated rearing (as discussed above) and diminished the accuracy of spatial representations of the conditioning context; this then can lead to higher generalized fear expression in future tests because similar contexts cannot be well distinguished from the conditioning context. In agreement with our hypothesis, S831/S845 double-phosphomutant mice, which display reduced GluA1-AMPAR synaptic delivery and signaling, also show significantly more rearing in the open field compared with wild-type animals (Kiselycznyk et al. 2013).
Of the amygdala nuclei, the BLA has been the one most extensively studied in the context of fear memory. About 80% of BLA synapses are excitatory (Tovote et al. 2015), and one of the signature features of fear learning is increased expression of AMPARs at around one-third of LA synapses (Rumpel et al. 2005). AMPARs are heterotetramers composed of dimers of subunit (GluA1–4) dimers, but the GluA4 subunit is barely expressed in adult neurons (Henley and Wilkinson 2016). In the amygdala of both mice and humans, the vast majority (>98%) of GluA2 subunits undergo Q/R editing, such that AMPARs containing the edited version are calcium-impermeable (Paschen et al. 2002; Brande-Eilat et al. 2015). Conversely, when the edited GluA2 subunit is mostly absent, such as during plasticity when synaptic GluA1 increases, receptors become calcium-permeable (Clem and Huganir 2010). Several lines of research indicate that GluA2-lacking AMPARs in BLA interneurons mediate LTP expression and fear learning (Mahanty and Sah 1998; Clem and Huganir 2010; Polepalli et al. 2010). There is also direct evidence for low expression of the GluA2 subunit in rat BLA spines (Gryder et al. 2005) and general retention of receptors containing this subunit in the cytoplasm, at least in thalamo–amygdala synapses (Radley et al. 2007). On the other hand, GluA1 is increased in rat BLA synapses following stressor exposure (Hubert et al. 2014), and acquisition of auditory and contextual fear conditioning is impaired in GluA1−/− mice, with LTP at thalamic inputs to LA neurons being completely absent (Humeau et al. 2007), which is not the case for GluA3−/− mice.
These studies indicate that synapses in the amygdala display a different AMPAR subunit profile, with GluA1 having a more prominent role, when compared with other brain areas such as the hippocampus, where GluA2 takes the lead (Lu et al. 2009). Therefore, it may not be surprising that we observed that freezing to the test context positively correlated with the amount of GluA1 expressed at postsynaptic densities (PSDs) of BLA synapses, implying an increased preponderance of calcium-permeable AMPAR-related effects; namely, via interneuron activation. Nevertheless, having sacrificed rats within 5 min following CS presentation during the test session, mobility of receptors in synaptic membranes following memory retrieval-induced synaptic activity needs to be considered when interpreting this correlation (Rao-Ruiz et al. 2011). Constitutively, in order just to maintain existing synaptic levels of AMPAR expression, it takes ∼10 min for ∼30% of AMPARs to exchange between synaptic and extrasynaptic membranes (Kerr and Blanpied 2012). Although their diffusion rate is increased when animals are fear conditioned (Yu et al. 2008), removal of AMPARs from thalamo–amygdala synapses—similar to what occurs during LTD or following fear memory retrieval (Nabavi et al. 2014; Bhattacharya et al. 2017; Rich et al. 2019), as is the case in our study—normally requires 15 min of low-frequency (1-Hz) stimulation (Wang and Gean 1999; Huang and Kandel 2007). Thus, in the context of our 5-min time window, during which we removed animals from the testing chamber and sacrificed them, any changes in AMPAR content at amygdala PSDs should be minimal.
Using the anesthetic isoflurane before extracting the brain could also have affected synaptic expression of AMPARs. However, findings from studies focusing on the hippocampus, one of the brain areas most vulnerable to the effects of anesthetic substances (Deng et al. 2014; Kang et al. 2017), suggest that it is very unlikely that isoflurane could have produced quick changes in GluA1-AMPAR numbers in the BLA. For example, isoflurane exposure did not affect expression of GluA1 protein (Qu et al. 2013) or its mRNA levels (Uchimoto et al. 2014) in rat hippocampal lysates or synaptoneurosomes up to 2 h after exposure. Furthermore, application of isoflurane in hippocampal neuronal cultures promoted a more than ∼30% reduction in the excitatory postsynaptic current amplitude evoked by 100 µM glutamate, but only for the highest tested concentration (1.22 µM) (de Sousa et al. 2000). Taken together, these studies indicate that a postsynaptic mechanism for anesthesia action on glutamatergic synapses mostly involves receptor antagonization rather than receptor removal from the plasma membrane. Therefore, in our setting, very brief (<2-min) isoflurane anesthesia before brain collection probably had no meaningful impact on AMPAR expression at amygdala-isolated PSDs and therefore is unlikely to explain our findings.
It remains an open question why some animals reacted more strongly than others to the first tone–shock pairing during auditory fear conditioning. One possible source of interindividual variation may reflect different influences of regulatory pathways, such as the serotonergic system, which tonically inhibits the amygdala (Asan et al. 2013). Several studies have found a direct relationship between inhibition of serotonin production and GluA1 expression (Tran and Keele 2011; Tran et al. 2013), making it possible that animals freezing strongly to the pre-CS also present with decreased serotonergic signaling. On the other hand, since dendritic hypertrophy with increased number of spines has been found in rat BLA neurons following suboptimal maternal care (Guadagno et al. 2018), differential early-life stress may epigenetically contribute to these variances in fear generalization. Interestingly, excessive maternal licking and grooming leads to poorer threat discrimination upon AFC that directly results from decreased activity in the vHC (Nguyen et al. 2018). Projections from the vHC to the BLA seem to regulate fear expressed in safe environments (Ortiz et al. 2019), and so it is possible that too much maternal care is responsible for vHC-driven inactivation of inhibitory routes within the BLA. Also, increases in synaptic GluA1 have been found at least 6 d following a repeated, unpredictable footshock protocol (Hubert et al. 2014), again implying a role for previous stressors in differential GluA1-AMPAR expression. Because the amygdala receives inputs from diverse structures, including the vHC, BNST, mPFC, NR, and MgN, and is under neuromodulatory control from several systems, proper fear discrimination will likely rely on adequate weighing and integration of various signals and on epigenetic changes within regional neural networks. Whether these or other mechanisms underlie the relationship between BLA glutamate receptor expression and fear generalization will require careful future work.
In summary, we identified a high freezing/low rearing behavioral profile expressed during the first exposure to a CS–US pairing in a novel training context that predicts later fear generalization to a known test context. We also showed that the extent of fear generalization correlated with postsynaptic expression of GluA1-AMPARs in the BLA. Therefore, careful analysis of various behaviors expressed during training will provide information useful in explaining interindividual differences in fear expression and its neurobiological correlates in these widely used experimental protocols. Our work further confirms the involvement of BLA postsynaptic GluA1-AMPAR expression in the complex process of generalized fear expression, with implications for fear- and anxiety-related disorders such as posttraumatic stress disorder (PTSD).
Materials and Methods
Subjects
We used 23 male Sprague–Dawley rats (Charles River) weighing 250–300 g at the time of arrival. Two independent animal cohorts were used for two AFC learning replicates (R1 and R2, see the Results). Original sample size was n = 12 for both replicates (total n = 24), but one animal from R2 was dismissed for the present study since it was an identified outlier (Grubbs test, Z = 3.11, P < 0.01; 47.1% freezing at acquisition time point TS1) (please see below for details). Rats were housed in pairs inside 26.7 × 48.3 × 20.3-cm Plexiglas cages (Ancare) with environmental enrichment provided by PVC hollow cylinders, 10 cm in diameter. Lights in the animal colony turned on at 7:00 a.m. and went off at 7:00 p.m. Animals were tested during the lights-on phase. Food and water were provided ad libitum.
Behavioral procedures
Handling and habituation
Upon arrival, we handled rats in the colony for seven consecutive days. This was followed by three consecutive days of habituation to the testing box (context A) in which we would later assess conditioned auditory fear (Fig. 1A). Context A consisted of a 30 × 25 × 30-cm Plexiglas box (Coulbourn Instruments) with a white plastic floor and arched white Plexiglas back walls, incandescent house light (5 lm), and a distinct odor (30% peppermint solution). A camera mounted on top of the box recorded the animals. The testing box was housed inside a sound-attenuating chamber with a fan that provided ventilation. A set of four such chambers was placed inside a bright illuminated room. For each of the 3 d of habituation, we placed rats inside context A for 5 min, after which we returned them to their colony.
Auditory fear conditioning
Rats were fear conditioned inside the training context (context B)—a 30 × 25 × 30-cm Plexiglas box with a metal grid floor for shock delivery (Coulbourn Instruments), illuminated in red light (dark environment), and distinguishable further by an odor (30% vanilla solution). The box was housed in a sound-attenuating chamber and ventilated with a fan. A set of four such chambers was placed inside a dark testing room attached to a dark antechamber. After transportation from the colony, we held animals in the antechamber for 5–10 min before the procedure started. Once rats were placed into a box, the first tone (4 kHz at 75 dB for 30 sec) was presented after 2 min (Pre). It coterminated with a footshock (0.75 mA for 1 sec; TS1). Ninety seconds later (ITI [intertrial interval]), the second tone–shock pairing was administered (TS2). Sixty seconds later (Post), animals were removed from the box and returned to their home cages and back to their colony (see Figs. 1A, 2A). A camera mounted on the front wall of the conditioning box recorded the sessions for later analysis.
Fear memory retrieval (test)
We tested rats in context A. After transportation from the colony, animals were immediately placed individually inside a testing box, where they remained for a total of 3.5 min. After 2 min in the testing box (pre-CS), a 4-kHz (75-dB) tone was played for 30 sec (CS). We removed the animals 60 sec later.
Animal sacrifice
We sacrificed animals 5 min after the test session. We induced deep anesthesia by placing individual rats inside an isoflurane gas-filled desiccator for no more than 2 min. Then, we quickly decapitated the rat. We collected brains, put them into small metal mesh cups that we immediately immersed into liquid nitrogen for ∼20 sec, and then wrapped the brains with aluminum foil. The frozen brains were then stored at −80°C until further processing.
Tissue collection
We collected amygdala tissue inside a cryostat microtome (Microm Instrumentations), punching through coronal sections (Fig. 6) with a 1-mm Neuro Punch (Fine Science Tools) at the amygdala, next to the external capsule, located approximately −1.80 to −3.96 mm from bregma, and interaural 7.20–5.04 mm (Paxinos and Watson 2004). Cryosectioning and punching were performed at −20°C with tissue collected into vials containing homogenization buffer (30 mM Tris-HCl at pH 7.5, 1 mM EGTA, 4 mM EDTA, two minitablets of EDTA-free Complete protease inhibitors [Roche]) on ice and homogenized with a small hand homogenizer.
Differential centrifugation for postsynaptic density (PSD) isolation
All centrifugation steps were carried out at +4°C. Briefly, samples were centrifuged at 500g for 10 min to remove nuclei and cell debris, and the supernatant was further centrifuged at 100,000g (Beckman Coulter) for 60 min to separate the cytosol (supernatant) from membranes and organelles (pellet). The pellet was resuspended in 0.5% Triton X-100, incubated at room temperature for 20 min, applied over a sucrose cushion (1 M sucrose, 1 mM EGTA, 4 mM EDTA at pH 7.4), and further density-centrifuged at 100,000g for 60 min. Forty microliters to 60 µL of supernatant was stored at −20°C as a Triton X-100-soluble fraction (extrasynaptic fraction) with the remainder discarded, and the pellet was resuspended in RIPA buffer and stored at −20°C as the Triton X-100-insoluble fraction containing the postsynaptic density (PSD) proteins (postsynaptic fraction).
Protein quantification
Total sample protein was determined using the bicinchoninic acid (BCA) assay (Pierce). In brief, 200 µL of working reagent was added to 2–8 µL of sample and incubated for 30 min at +37°C. Absorbance was read at 565 nm in a microplate reader, and sample protein concentration was estimated by interpolation from a bovine serum albumin (BSA) standard curve. Laemmli sample buffer was added to all original samples, and these were stored at −20°C until later use.
SDS-PAGE and immunoblotting
For normalization purposes, we loaded the same amount (3 µg) of total protein from each sample into either 8% or 10% T polyacrylamide gels and ran them at constant voltage (60 V for ∼40 min, plus 120 V for ∼1–2 h). We transferred proteins onto 0.45-µm PVDF membranes at constant current (300 mA) for 1 h and immunodetected them using specific primary antibodies against GluA1 (1:1000; Millipore) and GluA2 (1:1000; Millipore) subunits (∼1- to 2-h incubations) and an appropriate HRP-conjugated secondary antibody (1-h incubation). Signal was detected by chemiluminescence with an ECL kit (Pierce), and membranes were scanned using a Storm Laser scanner (Molecular Dynamics).
Data analysis
We measured freezing levels using FreezeView software with a 0.25 bout and an average 3.5 signal threshold. We manually confirmed the accuracy of the automatic measurement. An experimenter blind to condition measured rearing and grooming levels manually. We defined rearing as animals rising above half video screen, either solely supported by their hind legs or having their paws against the glass walls. We defined grooming as animals showing any of the four syntactic phases (elliptical, small unilateral, and large bilateral strokes and body licking). For each behavior, we measured the number of bouts and their duration. Although most literature reports behavior duration as phase percentage, we also decided to analyze data without transformation to avoid scaling effects. Immunoblotting bands were analyzed and quantified using ImageJ software. For statistical analyses, we used GraphPad Prism (D'Agostino and Pearson omnibus K2 normality test, Kendall's coefficient of concordance test, Friedman's test with Dunn–Bonferroni multiple comparisons post-hoc tests, and Wilcoxon matched-pairs signed rank test) and IBM SPSS statistics software (Student's t-test, Mann–Whitney U-test, Shapiro–Wilk normality test, Pearson and Spearman correlations, cluster analysis, and post-hoc power analysis). Specifically for cluster analysis, we used squared Euclidean distance as distance measure between cases, along with the between-group linkage clustering algorithm, also called average linkage method, which is the most stable to estimate cluster number and size (Yim and Ramdeen 2015). Since we intended to probe the occurrence of “behavioral” clusters, we used the same type of measure for all cases in the analysis: We chose duration in seconds because we did not include the grooming bout count in the study, thus precluding the use of grooming average bout duration and absolute bout frequency data (see Fig. 2A). Unless otherwise stated, we report mean ± 1 SEM. Except for Shapiro–Wilk normality tests, the null hypothesis was rejected whenever P < 0.05.
Acknowledgments
We thank Dr. Virginia Migues for her advice and insightful comments that helped us write and revise the paper. B.J.M. was supported by Fundação para a Ciência e a Tecnologia (FCT), Portugal, through PhD fellowship SFRH/BD/51284/2010, in association with the Programa Graduado em Áreas da Biologia Básica e Aplicada (GABBA), from the University of Porto, Portugal. O.H. and parts of this work were supported by grants from the Canadian Institutes of Health Research (PJT 175204), Natural Sciences and Engineering Research Council of Canada (RGPIN-2020-04795), Canadian Fund for Innovation (CFI-JELF 41168), and the Simons Initiative for the Developing Brain (R83731).
Footnotes
-
[Supplemental material is available for this article.]
-
Article is online at http://www.learnmem.org/cgi/doi/10.1101/lm.053612.122.
-
Freely available online through the Learning & Memory Open Access option.
- Received July 29, 2022.
- Accepted March 7, 2023.
This article, published in Learning & Memory, is available under a Creative Commons License (Attribution-NonCommercial 4.0 International), as described at http://creativecommons.org/licenses/by-nc/4.0/.



