


Repeated stimulation of feeding mechanoafferents in Aplysia generates responses consistent with the release of food
- 1Gonda (Goldschmied) Brain Res Center and Goodman Faculty of Life Science, Bar Ilan University, Ramat Gan 52900, Israel
- 2State Key Laboratory of Pharmaceutical Biotechnology, Institute for Brain Sciences, School Life Sciences, Nanjing University, Jiangsu 210023, China
- 3Departments of Biology, Neurosciences, and Biomedical Engineering, Case Western Reserve University, Cleveland, Ohio 44106-7080, USA
- Corresponding author: avy{at}biu.ac.il
Abstract
How does repeated stimulation of mechanoafferents affect feeding motor neurons? Monosynaptic connections from a mechanoafferent population in the Aplysia buccal ganglia to five motor followers with different functions were examined during repeated stimulus trains. The mechanoafferents produced both fast and slow synaptic outputs, which could be excitatory or inhibitory. In contrast, other Aplysia mechanoafferents produce only fast excitation on their followers. In addition, patterns of synaptic connections were different to the different motor followers. Some followers received both fast excitation and fast inhibition, whereas others received exclusively fast excitation. All followers showed strong decreases in fast postsynaptic potential (PSP) amplitude within a stimulus train. Fast and slow synaptic connections were of net opposite signs in some followers but not in others. For one follower, synaptic contacts were not uniform from all subareas of the mechanoafferent cluster. Differences in properties of the buccal ganglia mechanoafferents and other Aplysia mechanoafferents may arise because the buccal ganglia neurons innervate the interior of the feeding apparatus, rather than an external surface, and connect to motor neurons for muscles with different motor functions. Fast connection patterns suggest that these synapses may be activated when food slips, biasing the musculature to release food. The largest slow inhibitory synaptic PSPs may contribute to a delay in the onset of the next behavior. Additional functions are also possible.
Synaptic connections from primary mechanoafferents to their followers in Aplysia have provided much of the basic information on how synaptic changes underlie learning and memory. Cellular, synaptic, and biophysical mechanisms underlying short-term and long-term memory first identified in these synapses were subsequently found to function in mammalian learning and memory (Kandel 2002; Pittenger and Kandel 2003; Glanzman 2008; Hawkins and Byrne 2015). The connections between populations of Aplysia mechanoafferents in the abdominal, pleural, and cerebral ganglia to motor neuron followers have been studied (Castellucci et al. 1970; Byrne et al. 1974, 1978a,b; Rosen et al. 1979, 1982; Walters et al. 1983a,b; Dubuc and Castellucci 1991; Wan et al. 2012). Members of these populations have similar properties, in that they innervate areas of the external surface of the animals and synapse on populations of motor neurons that innervate muscles affecting the areas innervated by the mechanoafferents, thereby initiating withdrawal reflexes. The mechanoafferents also synapse on interneurons which may affect their actions on motor neurons (Cleary and Byrne 1993; Raymond and Byrne 1994; Xu et al. 1994; Frost and Kandel 1995).
Two groups of mechanoafferents in the buccal ganglia studied in less detail are similar in many ways (e.g., in synaptic depression, and in expression of the peptide sensorin-A) to the well-studied neurons in the abdominal, pleural, and cerebral ganglia (Walters et al. 2004). However, these mechanoafferents differ from the others in that they do not innervate the exterior surface, but rather they innervate the interior of the animal's feeding system (the interior of the buccal cavity, which is surrounded by the buccal muscles that affect feeding movements) (Ye et al. 2006), and synapse on neurons innervating buccal muscles with antagonistic functions that contract during different phases of feeding behaviors (Tam et al. 2020). The synapses from buccal ganglion mechanoafferents to their followers are also modified by an associative learning task affecting feeding (Tam et al. 2020).
A previous report (Tam et al. 2020) examined the postsynaptic response to a single action potential in these mechanoafferents, which induced a single postsynaptic potential (PSP) in the follower neurons and showed that patterns of synaptic connectivity are changed after learning, tending to bias the system toward rejection responses. However, it is unlikely that natural stimuli that might occur when animals eat will cause these mechanoafferents to fire only single spikes. When Aplysia consume food, the food remains within the mouth for several seconds before it is swallowed, or rejected (Kupfermann 1974), and thus is likely to initiate a series of action potentials. To extend our analysis of the patterns of connectivity between mechanoafferents and their followers, using the same data set as in Tam et al. (2020), we have now examined the response of motor neurons to intermittent trains of stimuli to the mechanoafferents. In addition to examining whether the response to intermittent stimulus trains may be different from the response to single action potentials, using stimulus trains to elicit a response also allowed us to examine possible effects on synaptic transmission of within-train and between-train plasticity, as well as the properties of slow synapses that are elicited only by repetitive firing. The present study also examined the possibility that connectivity from different subareas of the mechanoafferent cluster examined has different patterns of connectivity to the different followers.
The previous study (Tam et al. 2020) showed heterogeneous patterns of connectivity from the buccal ganglia mechanoafferent to their followers and suggested that there was a clear functional role for the patterns of connectivity in altering the behavioral bias toward rejection. The present report examines similarities and differences in the synaptic connections of these mechanoafferents to their followers, with respect to the outputs of superficially similar mechanoafferents that have been examined in the past. This is an important initial step in understanding the role of sensory feedback in the control of a complex behavior such as feeding, and how such feedback may be modified by repetitive input due to sustained mechanical but not chemical inputs. The accompanying paper (Hurwitz et al. 2024) examines how the properties of these synapses are changed in animals that display long-term memory after an associative learning task affecting feeding behavior.
The group of followers that we examined includes five neurons having different behavioral functions in producing Aplysia consummatory feeding behaviors. These behaviors consist of a sequential protraction of the toothed radula, followed by retraction. The radular halves can close to grasp food. During ingestion, the radula protracts open, and retracts closed, thereby grasping the food within the radular cleft as retraction of the radula pulls the food into the buccal cavity, or into the gut (Morton and Chiel 1993a,b; Ye et al. 2006). In contrast, during rejection, the radula protracts with its halves closed, thereby pushing an object out of the mouth, and then retracts with the halves open (Morton and Chiel 1993a,b). Thus, during ingestion, retraction is the power phase of the behavior, whereas during rejection, protraction is the power phase. One of the mechanoafferent followers that we examined (B31/B32) has a central role in deciding whether or not to initiate a consummatory response, as well as innervating the muscle producing protraction. A second (B61/B62) innervates the primary muscle active in protraction (Hurwitz et al. 1994, 1996; Drushel et al. 1998). The third (B3) is a large motor neuron to the muscle primarily affecting retraction (Gill and Chiel 2020), whereas the fourth (B8a/b) innervates a muscle that closes the radula (Morton and Chiel 1993b). Finally, a fifth (B4/B5) biases movement toward rejection via its effects on other motor neurons (Warman and Chiel 1995; Jing and Weiss 2001; Ye et al. 2006; Sasaki et al. 2009).
Our studies showed that the follower neurons of the buccal ganglia mechanoafferents are similar to the previously studied mechanoafferents, in that fast PSPs show prominent within-train decreases in amplitude (Phares et al. 2003). However, the buccal ganglia mechanoafferents differ from the previously studied mechanoafferents, in that they produce both fast and slow PSPs, rather than just fast PSPs. In addition, both excitatory and inhibitory connections are present, rather than just excitation. Moreover, unlike the previously studied mechanoafferents, which are a relatively uniform population having similar outputs to their followers (Byrne et al. 1974), many aspects of connectivity of the buccal ganglia mechanoafferents to the five followers were found not to be uniform. The decrease in response of the followers to stimulus trains in the mechanoafferents suggests that one function of these connections may be to respond to the movement of food within the mouth, and the slow inhibitory potential that develops in one connection may affect the likelihood that an animal will generate further feeding responses. These results are thus consistent with and extend our previous study (Tam et al. 2020).
Results
The buccal ganglia contain two populations of mechanoafferents with many properties similar to the mechanoafferents in the abdominal, pleural, and cerebral ganglia (Walters et al. 2004). We focused on one of these two populations, the S1 cluster. The experimental protocol was to deliver to individual S1 mechanoafferents three stimulus trains (10 sec between stimulus trains) of five brief depolarizations (1 nA, 250 msec duration between depolarizations), each producing a single action potential in the mechanoafferent neuron (Fig. 1A; Supplemental Fig. S1), while recording postsynaptic responses in identified follower neurons. Not all of the presynaptic neurons were connected to the postsynaptic followers. When they were connected, each stimulus train elicited five presynaptic action potentials, producing one-for-one fast PSPs with a constant latency following the presynaptic spike, and sometimes the five spikes also elicited a single slow PSP. The amplitudes of the first and fifth fast PSP in response to each stimulus train were measured, as was the amplitude of the slow PSP, if present. An example of a typical stimulus train and the measurements of the first and fifth fast PSP and of the slow PSP are shown in Supplemental Figure S1. After recording the connections between an S1 neuron and a motor follower, the recording electrode remained in the follower, and the other electrode impaled a second S1 cell. The S1 mechanoafferent cluster was subdivided into four subclusters (Fig. 1B), to determine possible differences in connectivity from these areas. Data on connectivity were initially examined for all four subclusters combined and were then examined separately for each subcluster. The experimental protocol allowed us to determine the number of possible variables that affect synaptic connectivity between the S1 mechanoafferents and the follower neurons: (1) Differences in patterns of connectivity (i.e., excitation or inhibition, or lack of connectivity) of PSPs among the five postsynaptic neurons that were examined; (2) possible changes between the first versus the last fast PSP within a stimulus train of five depolarizations delivered to a presynaptic cell; (3) possible effects of the three repetitions of the stimulus trains; and (4) possible differences in PSPs from four subareas of the S1 neurons. The present report focuses on data from naive animals. The following report (Hurwitz et al. 2024) compares these data to those from animals that had been trained using netted food leading to learning that a particular combination of taste and texture is inedible.
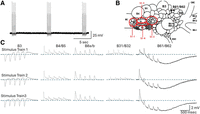
(A) Pattern of stimulation. Each presynaptic S1 neuron was stimulated with three trains of brief intracellular pulses, with each eliciting a single action potential. (B) Locations of the four subareas of the S1 cluster that were separately mapped for connectivity to the five follower neurons, as well as the locations of the follower cells investigated as targets of the S1 cells. (BN-1) Buccal nerve 1, (BN-2) buccal nerve 2, (BN-3) buccal nerve 3, (CBC) cerebral–buccal connective, (ESO) esophageal nerve, (BC) buccal commissure. The buccal ganglion is viewed from the caudal surface. (C) Examples of the response of the five follower neurons to three stimulus trains of five spikes each to an S1 neuron. Note the fast and slow responses, which may be of different signs in the various followers. Also note the changes in PSP amplitude within a stimulus train or between stimulus trains. The large slow IPSP in B61/B62 is particularly striking. Blue dashed lines denote the baseline membrane potentials.
The five follower cells differ in their functions. They also differed in their resting potentials (Supplemental Fig. S2). In addition, the five follower cells differed in the sign and amplitude of the fast PSPs that were initiated by each S1 neuron spike. In addition to the fast PSPs, slow synaptic potentials of various amplitudes and signs were elicited by a stimulus train (Fig. 1C). Note that four of the five followers (B4/B5, B8a/b, B31/B32, and B61/B62) are pairs of neurons with identical properties and are, therefore, treated as a single neuron. Additional examples of stimulus trains recorded in B3, B8a/b, and B31/B32 are shown in Supplemental Figure S3.
Heterogeneity of connectivity from S1 cell to followers
Fast PSPs
In the abdominal ganglion, 75%–89% of the mechanoafferents produce detectable excitatory postsynaptic potentials (EPSPs) in follower motor neurons in naive animals (Castellucci et al. 1970; Frost et al. 1985). In the cerebral ganglion, 30 of 30 tested mechanoafferents monosynaptically excited motor followers (Rosen et al. 1979). In contrast, in buccal ganglia S1 cells, the percentage of connected neurons varied from a low of 62% for B31/B32 to a high of 89% for B3 (note the Ns in Fig. 2A). In abdominal, pleural, and cerebral ganglia, mechanoafferents display only fast excitatory synaptic connections to their followers (Walters et al. 2004). In contrast, fast inhibitory connections to B3, B8a/b, and B61/B62 were observed along with fast excitatory connections, whereas only fast excitatory connections to B4/B5 and B31/B32 were present. For B8a/b and B61/B62, only small numbers of fast inhibitory postsynaptic potentials (IPSPs) were present (B8a/b: 5.8%; B61/B62: 14.0%), whereas for B3 almost 80% of the fast connections were inhibitory (Fig. 2A). For all tested connections from S1 to the five followers (496 connections in all), 17% were inhibitory, 55% were excitatory, and 28% were unconnected. The total N for connections to each follower (B3 = 88, B4 = 127, B8 = 139, B31 = 85, B61 = 57) was divided according to this proportion, to derive an expected number of each type of connection. This was tested against the observed for all five followers. For the fast connections, the differences in the distribution of excitation, inhibition, and lack of connection among the five followers were significant (P < 0.0001, χ2 = 1.09 × 10⁻¹⁵, df = 8, χ2 test). Thus, patterns of output from the same S1 mechanoafferents to the different followers are not the same, presumably because the followers have distinctive functions in feeding behavior.
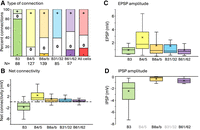
Connectivity of fast PSPs from S1 cells to five followers. Data combined from all subareas of the S1 cluster. (A) Distribution of excitatory (+), inhibitory (−), and unconnected (0) S1 neurons to each follower, and in all followers combined. The number of connections sampled is shown below the name of the follower. (B) Net connectivity (average of all six measures per cell) from the S1 cluster to each of the five followers. Boxes show upper and lower quartiles. The line within the box is the median, and × is the mean. Note that outliers were present (see Hurwitz et al. 2024 for the full distributions) and were included in all calculations but are not shown in these figures for esthetic reasons. Dashed line at zero. Note the differences in net connectivity. (C) Amplitude of the EPSPs recorded in each follower. Note that the N for B3 is small (N = 8), reflecting the small number of excitatory connections to B3. (D) Amplitude of IPSPs recorded in each follower. Note that there were no IPSPs recorded from two followers, and that Ns are small for B8a/b and for B61/B62 (Number of IPSPs: for B3 N = 70; for B8a/b N = 16; for B61/B62 N = 8), reflecting the small number of inhibitory connections, as seen in A.
Patterns of fast net connectivity to each follower reflected the relative distribution of excitation and inhibition (Fig. 2B). For each follower, net fast connectivity was determined by averaging the six measured fast PSPs (first and fifth in each of three stimulus train repetitions) for each measured connection, and then averaging these for the entire population of connections to a specific follower cell. Unconnected cells were given a value of zero. Net connectivity was inhibitory only for B3. Net excitation was highest for B4/B5, and net excitation was similar for B8a/b, B31/B32, and B61/B62. Differences in net connectivity were significant (P < 0.0001; two-tailed Kruskal–Wallis test). A post hoc Dunn's test using a Bonferroni corrected α of 0.005 showed that net connectivity from B3 and from B4/B5 are significantly different from one another and from the other three followers. In addition, the net connectivity to B8a/b and to B61/B62 is significantly different.
For connected cells, we also examined whether there are differences in the amplitude of fast EPSPs (Fig. 2C) or fast IPSPs (Fig. 2D) among the five followers. There were significant differences in both EPSP and IPSP amplitudes (for each, P < 0.00001; two-tailed Kruskal–Wallis tests). These findings are consistent with the separate patterns of connectivity to each of the followers.
Slow PSPs
In addition to five fast PSPs, a stimulus train also often elicited a single slow PSP (see Fig. 1). Slow PSPs in response to sustained natural stimulation of a stimulus field, or to trains of electrical stimulation, have not been documented for connections from the other Aplysia mechanoafferents (Byrne et al. 1974, 1978a,b; Rosen et al. 1979; Walters et al. 1983a,b; Phares et al. 2003). In a small number of cases, the slow PSPs were biphasic, with an IPSP following an EPSP, or vice versa. The distribution of the slow PSPs was very different from that of the fast PSPs (Fig. 3A); as for the fast PSPs, there were significant differences in the distribution of slow PSPs among the five postsynaptic cells (P < 0.0001, χ2 = 0.0047, df = 8, χ2 test). As for the fast PSPs, a single test compared the distribution of each follower to the expected distribution based on all followers combined, with B8a/b having the least percentage of slow PSPs, B4/B5 having only excitatory slow PSPs, and B61/B62 having a majority of inhibitory slow PSPs. Net connectivity of the slow PSPs was generally of smaller amplitude than was the net connectivity of the fast PSPs (Fig. 3B). To quantify the difference in amplitude between the fast and slow PSP, the absolute values of the PSP amplitudes (excluding zeros) were compared (for B3 and B4/B5: P < 0.00001; for B8a/b: P = 0.0018; for B31/B32: P = 0.069; for B61/B62: P = 0.0007; two-tailed Mann–Whitney U-tests). There were significant differences in the net connectivity among the five follower cells (P < 0.00001; two-tailed Kruskal–Wallis test). A post hoc Dunn's test using a Bonferroni corrected α of 0.005 showed that there were significant differences in net connectivity between B3 and B8a/b and B61/B62; from B4/B5 and B8a/b and B61/B62; between B8a/b and B4/B5 and B61/B62; and between B31/B32 and B61/B62. There were also significant differences in the amplitude of the slow EPSPs (P = 0.0004; two-tailed Kruskal–Wallis test) (Fig. 3C) and of slow IPSPs (P = 0.0003; two-tailed Kruskal–Wallis test) to the different followers (Fig. 3D).
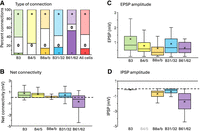
Connectivity of slow PSPs from S1 cells to five followers. Data combined from all subareas of S1. (A) Distribution of excitatory (+), inhibitory (−), and unconnected (0) S1 neurons to each follower, and in all followers combined. (B) Net connectivity (average of three measures per cell) from the S1 cluster to follower. Boxes show upper and lower quartiles. The line within the box is the median, and × is the mean. Outliers not shown but were included in all calculations. Dashed line at zero. Note differences in net connectivity. (C) Amplitude of the slow EPSPs in each of the followers. (D) Amplitude of slow IPSPs in each follower. Note that there were no slow IPSPs recorded from B4/B5.
Note that for B3 and B61/B62, the fast and slow PSPs are primarily of opposite sign (for B3, fast PSPs are primarily inhibitory, and slow PSPs are primarily excitatory; for B61/B62, the opposite is the case), whereas for B4/B5 both fast and slow PSPs are primarily excitatory.
Plasticity within and between stimulus trains
Repetition of five stimuli within a stimulus train, and repetition of the stimulus train three times, allowed us to assess whether the amplitude of the fast PSPs changes within a stimulus train or between stimulus trains.
Within stimulus train plasticity has been examined in detail previously in other Aplysia mechanoafferents, and it was shown that fast EPSP amplitudes decrease with stimulus repetition (Phares et al. 2003). To test whether fast synaptic connections from the S1 buccal ganglia mechanoafferents show similar plasticity, we averaged the first PSP in the three stimulus trains and averaged the fifth PSP in the three stimulus trains and calculated the difference. We then counted the number of times that there was an increase or decrease in PSP amplitude or no change in amplitude, and tested these values against the null hypothesis, that increases and decreases and absence of change will be equally likely, using a χ2 test (Fig. 4A). We also calculated the average percent difference (fifth minus first PSP divided by first PSP times 100) in amplitude between the first and fifth fast PSP within each of the three stimulus trains (Fig. 4B). Calculations were performed separately for each follower, and separately for excitatory and inhibitory connections.
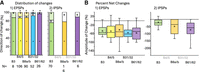
Within-train plasticity of fast PSPs. (A) Likelihood of increase (+), decrease (−), or lack of change (0) in the amplitude of the fast PSP from the first to the fifth fast PSP within a stimulus train measured in all five followers. Data are shown separately for EPSPs and IPSPs. Note that for B3, there are few EPSPs, and for B8a/b and B61/B62 there are few IPSPs. (B) Percent net change in amplitude from the first to the fifth PSP within a stimulus train measured in all five followers. Data are shown separately for EPSPs and IPSPs. Boxes show upper and lower quartiles. The line within the box is the median, and × is the mean. Dashed line at zero. Outliers are not shown but were included in all calculations.
Within stimulus trains, there was a strong tendency for PSP amplitude to decrease from the first to the fifth PSP. We quantified the decreases separately for EPSPs and IPSPs. For EPSPs, there were significantly more decreases in amplitude from the first to the fifth response within a stimulus train in four of the five follower neurons (P < 0.0001, χ2 tests). For the fifth follower, B3, the reduction in EPSP amplitude was similar to that in the other four followers, but there were too few EPSPs to test the significance (Fig. 4A1). For IPSPs in B3, there were significantly more reductions than increases in amplitude (P < 0.00001, χ2 test). Similar reductions were seen in B8a/b and in B61/B62, but there were too few IPSPs to test the significance (Fig. 4A2).
We also compared the percent change in amplitude within a stimulus train for fast EPSPs and IPSPs among the five followers (Fig. 4B). For EPSPs, there were no significant differences in the change in amplitude among the five followers (P = 0.539; Kruskal–Wallis test), indicating that a similar process may cause the within-train decrement in excitatory connections to all five followers (Fig. 4B1). For IPSPs, a comparison of changes in IPSP amplitude among the three followers displaying IPSPs showed a significant difference (P = 0.017; Kruskal–Wallis test), with the largest reduction in IPSP amplitude in B61/B62 (Fig. 4B2). Note that the reduction in IPSP amplitude in B3 was ∼20%, which is a much smaller reduction than the 45%–55% reduction in EPSP amplitude seen in all of the other followers. These data suggest that separate homosynaptic processes may govern within stimulus train decrement of fast EPSP and IPSP amplitudes, and, in addition, the difference in IPSP decrement to B3 and B61/B62 indicates that decrement of IPSPs to different followers may also be governed by different processes. However, the differences might also be explained by the different input resistances of the followers.
We also tested plasticity that arises as a result of repetition of the three stimulus trains. Plasticity of fast PSPs due to repetition of the three stimulus trains was present (Fig. 5; Supplemental Fig. S4A–C). For EPSPs, a trend was present to enhance the prominence of the earlier EPSPs within the stimulus train at the expense of the later EPSPs, by increases in the amplitude of the first EPSP in the stimulus train and a decrease in the amplitude of the fifth EPSP in the stimulus train. This effect was reflected in increases in the amplitude of the first fast EPSP from the first to the second stimulus train in two follower neurons and decreases in amplitude for the fifth EPSP from the first to the second stimulus train in four followers (Fig. 5A). From the second to the third stimulus train, there were no additional increases in EPSP amplitude for the first EPSP, but there were significant decreases in the EPSP amplitude in the fifth EPSP in two followers (Fig. 5B) (Statistics in Supplemental Text No. 1).
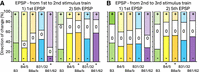
Between stimulus train plasticity of the fast EPSPs in naive animals. For EPSPs measured in the follower cells, changes in the distribution between increases (+), decreases (−), or lack of change (0) from one stimulus train to another. (A) Changes in EPSP amplitude from the first to the second stimulus train. (B) Changes in EPSP amplitude from the second to the third stimulus train. Data are shown separately for (1) changes in the first EPSP in a stimulus train, and (2) changes in the fifth EPSP in a stimulus train. Significant changes in the distribution are marked by an asterisk.
We also examined possible changes in slow PSP amplitude between stimulus trains. There were no significant differences in the amplitude of slow PSPs between the three stimulus trains for any of the five follower neurons (0.49 < P < 0.77; Kruskal–Wallis tests) (not shown).
Differences in connectivity between subareas of the S1 cluster
As noted above (see Fig. 1B), the S1 mechanoafferent cluster was subdivided into four areas. We examined whether there are differences in connectivity to follower neurons among the four subareas.
As a first test for possible differences in connectivity, we examined the net connectivity of fast PSPs to each of the five follower cells from each of the four subareas (Fig. 6A–E). For B4/B5, there was a significant difference in net connectivity to the four subareas (P = 0.021; Kruskal–Wallis test), with a markedly greater connectivity in area S1-1 than in the other three areas. There were no significant differences in net connectivity between the four subareas to the other four follower cells (0.359 < P < 0.692; Kruskal–Wallis test).
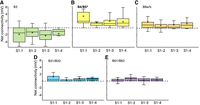
Net connectivity of fast PSPs from each of four subareas of the S1 cluster, for each of the five follower cells (A–E) in naive animals. Net connectivity (mean of six measures per cell) is shown. Boxes show upper and lower quartiles. The line within the box is the median, and × is the mean. Note that outliers are not shown but were included in all calculations. Dashed line at zero. Only B4/B5 (marked with bold and asterisk) shows a difference in connectivity among the four subareas, with the largest connectivity in S1-1.
Larger increases in connectivity to B4/B5 from S1-1 could arise as a result of fewer unconnected cells, or as a result of larger EPSPs, or both. We tested these possibilities. There was no significant difference in the proportion of connected versus unconnected cells among the four subclusters of S1 (P = 0.97, df = 3, χ2 test). However, there was a significant difference in the amplitude of the first EPSP in a train (P = 0.003; two-tailed Kruskal–Wallis test), with no significant difference in amplitude of the fifth EPSP in a train (P = 0.140; two-tailed Kruskal–Wallis test) (not shown). Thus, the increased excitation to B4/B5 in the S1-1 subcluster is attributable to an increased amplitude of the first PSP in a stimulus train.
To localize the connections with particularly large EPSPs to B4/5, we mapped the amplitude of each recorded fast EPSP (first EPSP in the first stimulus train) onto a standard drawing of the S1-1 subcluster. The mapping showed an area in the center of the S1-1 subcluster where large-amplitude EPSPs were found (Supplemental Fig. S5). An example of a train of five stimuli to an S1-1 neuron that elicits large EPSPs in B4 is shown in Supplemental Figure S6.
We also examined possible changes in slow PSP amplitude in the five followers in the different subareas of the S1 cluster (Fig. 7A–E). There were significant differences in B3 (P = 0.046; Kruskal–Wallis test, with false discovery rate [FDR] correction) and in B61/B62 (P = 0.046; Kruskal–Wallis test, with FDR correction), with no significant differences in the other three followers (0.295 < P < 9.832; Kruskal–Wallis test, with FDR correction). For B3, the net connectivity of the slow PSPs was excitatory, and net amplitudes of the excitation were almost a third less in S1-1 than in the other three subareas. For B61/B62, the net connectivity of the slow PSPs was inhibitory, and the net inhibition in S1-4 was almost three times larger than in the next closest subarea.
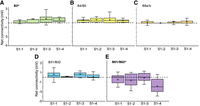
Net connectivity of slow PSPs to each of four subareas of the S1 cluster, for each of the five follower cells (A–E) in naive animals. Net connectivity (mean of three measures per cell) is shown. Boxes show upper and lower quartiles. The line within the box is the median, and × is the mean. Note that outliers are not shown but were included in all calculations. Dashed line at zero. Significant differences in connectivity between subareas was found for B3 and B61/B62 (marked with bold and asterisk).
These data indicate that the four subareas of the S1 cluster are not identical, and cells in different regions of the S1 cluster might have different functions.
Discussion
We have broadened our exploration of connectivity from buccal ganglia mechanoafferents to their followers by examining the effects of injecting stimulus trains in the mechanoafferents and recording the responses in followers, rather than examining the effects of a single presynaptic spike as a stimulus in the previous work (Tam et al. 2020). These experiments extended our understanding of the connections between the S1 mechanoafferents and five synaptic follower neurons within the buccal ganglia in naive animals to characterize how sustained mechanical stimulation without chemical stimulation might alter the synapse between primary mechanoafferents and motor neurons. They also serve as a prelude to understanding their possible functions in learning that a food is inedible and to examining how learning might change these connections. Patterns of connectivity were not uniform to the five followers and differed between the followers in at least five different ways. First, the proportion of S1 cells connected to each of the five followers was not the same, for either fast or slow synaptic connections. Second, two followers, B4/B5 and B31/B32, received exclusively excitatory fast connections, whereas the others received a mixture of fast excitation and inhibition, but the relative number of fast excitatory and inhibitory synapses was not the same in the different followers. For B3, the net connection was inhibitory, whereas for B8a/b and for B61/B62 the net connections were excitatory (see Fig. 2B). Third, amplitudes of fast EPSPs and fast IPSPs varied among the followers. Fourth, for some followers, the net fast and slow connections had opposite signs (e.g., B3, B61/B62), whereas for others the net fast and slow connections complemented one another. Fifth, for B4/B5 the most medial region of the S1 cluster (S1-1) was more strongly connected with fast EPSPs than were the other regions, whereas for the other followers, there were no differences in connectivity of fast PSPs among the different subareas of S1. For slow PSPs, there were differences in connectivity from the four subareas of S1 to B3 and B61/B62. All followers showed strong decreases in fast PSP amplitude within a stimulus train, and a weak tendency to increase this effect from the first to the second stimulus train.
Comparing the S1 connections to those of other Aplysia mechanoafferents
The buccal ganglia S1 cluster neurons that we studied have characteristics in common with three other Aplysia mechanoafferent populations, but nonetheless also have major differences. Previous work on these mechanoafferents, in the abdominal, pleural, and cerebral ganglia (Castellucci et al. 1970; Byrne et al. 1974, 1978a,b; Rosen et al. 1979, 1982; Walters et al. 1983a,b; Dubuc and Castellucci 1991; Wan et al. 2012), showed that their direct outputs are exclusively excitatory, and they use glutamate as their primary transmitter (Dale and Kandel 1993). The abdominal, pleural, and cerebral ganglion mechanoafferents, as well as the buccal ganglia S1 and S2 mechanoafferents, all express a peptide, sensorin-A (Walters et al. 2004), whose expression is restricted to these mechanoafferents (Brunet et al. 1991). Abdominal, pleural, and cerebral ganglion mechanoafferents are variable, in that they innervate different areas, and may have larger or smaller receptive fields, but are otherwise relatively uniform in their properties and their synaptic outputs (Byrne et al. 1974; Rosen et al. 1979; Walters et al. 1983a).
Despite many features in common, the synaptic properties of the S1 neurons differ remarkably from those of other Aplysia mechanoafferents. First, fast outputs from the S1 neurons can be either excitatory or inhibitory, with some followers receiving exclusively excitation, whereas others receive a mixture of excitation and inhibition. Second, the population of S1 is heterogeneous, in that some areas produce especially large fast PSPs onto selected followers. Third, the S1 neurons produce both fast and slow synaptic effects on followers; slow PSPs have not been documented in the other clusters. Vilim et al. (2010) previously showed that the S1 neurons synthesize and release the peptide cotransmitters FRFamide and FMRFamide. These might have a role in generating the slow PSPs. Additional differences have been noted in previous studies. Walters et al. (2004) noted that spike durations in the buccal ganglion S cells are two times broader than in other sensorin-positive mechanoafferents, and spike after hyperpolarizations in the S cells are three times larger than in the other mechanoafferents. In addition, the S cells show little or no sensory adaptation to a touch of the receptive field, and little spike accommodation in response to maintained depolarization, whereas other mechanoafferents show some accommodation (Walters et al. 2004). Fiore and Meunier (1979) reported that buccal ganglia S cells also excite one another, whereas other mechanoafferents do not.
Our data suggest that some S1 mechanoafferents produce PSP of opposite signs to different followers. Because we did not record simultaneously from two followers and observe opposite responses, we cannot absolutely claim that this occurs. But the data presented strongly imply that it does. When stimulating the same population of cells, 100% of the connected B4/B5 and B31/B32 neurons were excited, whereas 90% of the connected B3 neurons were inhibited.
Perhaps the most similar of the other sensorin-positive neurons to the S1 neurons that we have examined is the J cluster of the cerebral ganglion. In addition to producing conventional EPSPs onto motor neurons within the cerebral and buccal ganglia (Rosen et al. 1979, 1989), they modulate mechanoafferents in the pleural ganglion and motor neurons in the pedal ganglion (Raymond and Byrne 1994). Both slow modulatory effects as well as fast excitation and inhibition were observed. No systematic experiments were performed to determine whether these effects are monosynaptic or polysynaptic. Frost and Kandel (1995) have described a set of interneurons interposed between primary mechanoafferents in the abdominal ganglion and motor neurons which produce fast and slow connections, as well as excitatory and inhibitory connections. The complex direct output of the S1 neurons to their followers indicates that these neurons have properties of both primary afferents as well as interneurons that in other ganglia are recruited by the primary afferents.
Additional Aplysia mechanoafferents in the feeding motor system are found that do not express sensorin, such as B21 and other SCP-containing radula mechanoafferents (Miller et al. 1994; Cropper et al. 1996; Evans et al. 1999; Borovikov et al. 2000; Rosen et al. 2000) and cerebral ganglion neuron C2 (Weiss et al. 1986a,b; Jacklet 1995), often have unusual properties not found in conventional mechanoafferents, and therefore may have features in common with those seen in the S1 cells. Many are not pure sensory neurons and fire during motor activity, even in the absence of sensory input. They also may have complex outputs, producing different effects on different followers, and may release both conventional neurotransmitters as well as peptide cotransmitters. Thus, although not commonly reported, the complex and varied outputs of the S1 neurons are not unprecedented.
Plasticity in Aplysia mechanoafferents
Homosynaptic plasticity has been intensively studied in other Aplysia sensorin-positive mechanoafferents. These show profound synaptic depression when stimulated at low rates of one spike per second to one spike per 100 sec (Rosen et al. 1979; Byrne 1982). Few studies have examined the effects of trains of stimuli on synaptic output. These found that tetani of more than eight spikes at frequencies of 20 Hz induce posttetanic potentiation (PTP) (Walters and Byrne 1984; Eliot et al. 1994). In our experiments, the rate and the number of spikes would not have induced PTP. In addition, trains of two to four spikes protect against the homosynaptic decrement induced by the repetition of single spikes (Wan et al. 2012). It is likely that such protection was present in our experiments because we did not observe decreases in the amplitude of the first fast EPSP in a train across stimulus trains. In response to a 1 sec stimulus train at 10 Hz, followers show a gradual decrease in EPSP amplitude, reaching a value of 20% of the initial amplitude by the fifth spike (Phares et al. 2003), which is somewhat larger than the decrement found to followers of the S1 mechanoafferents.
Possible functions of the S1 buccal ganglia motor neurons connection
Differences in properties between the S1 neurons and the abdominal and pleural ganglia sensorin-positive mechanoafferents presumably reflect differences in function. The abdominal, pleural, and cerebral ganglion mechanoafferents innervate the external skin, and signal touch of the skin. The primary information conveyed by the population is the location and intensity of the touch, and connections to motor neurons may initiate a brief or intense local contraction. This information is relatively well served by a more-or-less homogeneous population of afferents that produce only excitation onto their followers. More complex responses, as well as modulation of responses to distant areas, are mediated by recruiting interneurons (Frost et al. 1985; Cleary and Byrne 1993; Raymond and Byrne 1994).
In contrast, the S1 neurons innervate the interior of the buccal mass and synapse directly onto motor neurons to muscles of different functions. Their role is presumably to signal the presence of food at a particular site within the buccal mass, or perhaps the movement of muscles or food, and to change feeding motor patterns in accordance with the sensory information. They may even function to identify complex features of the food, so that the food can be more easily manipulated. Similar to the other nonconventional mechanoafferents (i.e., B21 and C2 mentioned above) in the feeding motor system, they may have a role in moment-to-moment decisions on which of a number of different feeding responses are appropriate, as well as modulating the strength of a particular feeding response. Thus, the monosynaptic information that these afferents convey is richer than that of abdominal and pleural ganglia afferents, and the behavioral response to the information is likely to be more complex.
We have not yet mapped the receptive fields and stimuli to which the S1 neurons respond, and how these stimuli might affect motor activity. However, the properties of the connections suggest a possible function of the connections. Connections from the buccal ganglia mechanoafferents to their followers show prominent within-train depression, as do the sensorin-positive mechanoafferents in the pleural ganglia (Phares et al. 2003). The opposite effects of fast and slow PSPs seen in some of the followers (e.g., B3 and B61/B62) will accentuate the within-train decrease in PSP amplitude. Thus, in spite of minimal sensory adaptation to a stimulus and minimal spike accommodation (Walters et al. 2004), the output of the S1 neurons to the followers that we have examined is transient, due to the within-train decrease in amplitude, emphasizing the importance of the earlier PSPs in a stimulus train. A previous study on other Aplysia mechanoafferents (Phares et al. 2003) showed that in spite of the decrease in PSP amplitude during a train of stimuli, the small-amplitude PSPs late in the train are effective in summating with PSPs from additional afferents and initiating spikes in postsynaptic targets. Slip of a tactile stimulus across a surface in mammals is detected via transient responses of rapidly adapting receptors whose output is detected by higher-order neurons that are excited by the summation of inputs from successive sensory neurons (Srinivasan et al. 1990). In canonical mammalian movement receptors, the primary afferents adapt rapidly (Handler and Ginty 2021). Although in the Aplysia mechanoafferents there is little accommodation (Walters et al. 2004), nonetheless the synaptic output to the followers that we examined decreases rapidly. The actions of the S1 mechanoafferents on their followers will be similar to those of rapidly adapting receptors and will be sensitive to movement. A constant mechanical stimulus may generate a rapidly decrementing response, as we observed in this study, whereas a stimulus that moves across sensory areas, which will tend to generate the initial larger responses that were observed, might create larger responses across a population of the sensory neurons, which could thus be more sensitive to slippage.
The S1 cells may have a number of functions, based on different outputs to different populations of followers. However, we propose that a function of the connections of the S1 cells to the specific followers that we have examined may be to detect the movement of food across the radula, perhaps slippage of food as the animal attempts but fails to grasp it and move it inward during retraction. If the grasp is incomplete, the radula will rotate inward during retraction, but food will not rotate along with the radula. This will create a sensation of outward movement along the radula surface. One function of the S1 neurons may be to detect such movement. Tension measurements of attempts to swallow inedible netted foods that lead to learning have shown that such slippage indeed occurs (J Gill, AJ Susswein, and HJ Chiel, unpubl. observations). Similarly, if tidal surge or other mechanical movement of the seaweed induces it to move relative to the buccal musculature, these neurons could detect such movements.
The pattern of the fast connections from the mechanoafferents to its followers suggests that activation of the mechanoafferents may bias feeding to rejection or release of food that is already within the mouth that animals are attempting to swallow. Thus, the mechanoafferents produce a net inhibition of retractor motor neuron B3 and net excitation of protractor motor neurons B31/B32 and B61/B62. In addition, they produce excitation of B4/B5, which inhibits the retraction phase motor neurons, as well as inhibiting B8a/b, which close the radula on food (Tam et al. 2020). Together, these actions will bias behavior to the release of the food already within the mouth. An additional striking response is the large slow IPSP in B61/B62, which might tend to bias an animal to stop responding to food by inhibiting protraction responses.
An additional possible function may be to reduce the response to purely mechanical stimuli within the mouth. When Aplysia are induced to swallow a cannula, they slowly eject it. Rates of response when rejecting the cannula are relatively slow. B31/B32 and B61/B62 are motor neurons innervating the muscle producing the first phase of feeding, protraction (Hurwitz et al. 1994, 1996). Connections from the S1 neurons to these motor neurons suggest that animals will respond poorly when a nonfood object is within the mouth, and chemosensory inputs are absent. Thus, excitation to B31/B32 is weak, and B61/B62 receives strong slow inhibition from the S1 mechanoafferents.
The complex patterns of synaptic connectivity to followers suggest that there are additional functions, because the proposed functions do not explain the presence of some fast excitatory connections from the S1 cells to B3, or the presence of some fast inhibitory connection to B61/B62. In addition, the slow connections are likely to influence the activity of the followers in unexplored functions. The mixed connections to B8a/b may reflect the mixed function of these motor neurons, which are active in different phases of feeding in different feeding behaviors (ingestion and rejection). Ultimately, understanding the messages conveyed from the S1 neurons to their followers will require mapping the innervation patterns of individual S1 neurons, to determine whether different areas of the S1 cluster are sensitive to different types of stimuli, and whether sensory neurons with different output patterns convey different messages.
Aplysia can learn that food is edible, if they succeed in swallowing it (Susswein et al. 1986; Lechner et al. 2000; Brembs et al. 2002; Baxter and Byrne 2006), or that it is inedible, if they fail to swallow food (Susswein et al. 1986). The next paper (Hurwitz et al. 2024) shows that the patterns of connectivity leading to the release of food are increased after animals learn that a food is inedible. The presence of a minority of synaptic connections that are opposite to those leading to the release of food suggests that they may be important in learning about successful swallowing, and these connections may be increased by success. We have not yet examined this possibility.
It is important to note that there are differences in PSP decrement to different follower neurons. Thus, the decrement of all fast EPSPs from the first to the fifth stimulus is ∼45%–55%, whereas the decrement of IPSPs to B3 is approximately half of that (Fig. 5B). Even fast synaptic responses may have different functions at different targets. It is possible that output to other followers that we have not explored does not decrement at all, or perhaps even shows facilitation. The decision on which of a number of different feeding behaviors is appropriate is made in the cerebral ganglion by recruiting different combinations of cerebral–buccal interneurons (CBIs) (Jing and Weiss 2001; Morgan et al. 2002; Evans et al. 2021). The CBIs in turn receive feedback input from a small population of buccal–cerebral interneurons (BCIs) (Hurwitz et al. 1999). Because the choice of which of a number of responses to perform is likely to be influenced by feedback from attempts to swallow food, the BCIs may also receive input from the S1 mechanoafferents, and these connections may differ in their plasticity from those to the motor neurons that we have studied.
In conclusion, the S1 neurons are likely to mediate a number of functions, based on the characteristics of their different outputs to different followers. The specific outputs to the five followers that we examined in this report set a background for studies on how these outputs are changed when animals express memory as a result of learning that a food is inedible. This is the subject of the following report (Hurwitz et al. 2024).
Materials and Methods
The data are from the same data set presented in Tam et al. (2020). The data were reanalyzed from the original recordings, paying attention to aspects of the data set that were not previously presented. Additional connections to the five followers were also examined.
Animals
Aplysia californica weighing 50–250 g were purchased from Marinus Scientific and were stored in 600 L tanks filled with natural Mediterranean seawater maintained at 17°C. Experiments were done at room temperature. While stored, animals were fed two to three times weekly with Ulva lactuca gathered from the Mediterranean coasts of Israel, or purchased from Seakura (https://www.seakura.co.il/en/), and stored frozen until used.
Electrophysiology
Naive, untrained animals were injected with 25%–50% isotonic MgCl2, dissected, and the buccal ganglia were removed and pinned to Sylgard on the bottom of a petri dish, and the caudal surface of the ganglia was desheathed. The S1 neurons are one of two clusters of mechanoafferent neurons that innervate the interior of the buccal mass. A standard map of the S1 cluster was prepared, and S1 neurons that were impaled were marked on the map. While recording from a member of the S1 cluster, one of the five follower cells was penetrated, and synaptic connections from the S1 neuron to the follower were characterized. After recording from the S1 neuron to its follower, the electrode was removed from the S1 neuron, and it impaled a second S1 neuron. Its location was noted on the standard map, and its synaptic connections to the follower were characterized. A number of S1 neurons were sampled while recording from the same follower neuron. A new copy of the standard map was used for each follower.
The relative percentage of mechanoafferents that were sampled can be estimated by examining Supplemental Figure S5, which shows the EPSP amplitudes recorded in one follower in response to sampling one subarea of the S1 cluster in different experiments. The cells marked as the same on the map are not always the same in life, but they are close. The figure shows that 16 of 20 neurons were sampled. This probably is representative for other areas of the S1 cluster, and for other followers as well. Our overall estimate is that on the surface of the entire S1 cluster, there are approximately 100 neurons, and that in each subcluster, there are approximately 25 neurons. In any given experiment, one to 12 connections to a particular follower from S1 cluster neurons were examined, and there were 80 experiments on naive animals. A total of 501 connections were sampled. So a substantial percentage of the connections were sampled.
Electrodes were pulled with a Sutter Brown–Flaming type Model 97 puller, using 1 mm thin-walled glass with a filament. The electrodes were filled with 3 mM Potassium Acetate and had resistances of 40–60 MΩ. Recordings were via an Axoclamp 2 voltage clamp/amplifier in current clamp mode. After documenting the connectivity, additional S1 neurons were penetrated, and connectivity was measured. Presynaptic (S1) neurons were stimulated with pulses of depolarizing currents (1 nA, 30 msec duration, 10 Hz). Each pulse initiated a single action potential. Three trains of five stimuli were delivered 10 sec apart, for a total of 15 pulses.
All fast PSPs that are part of the analyzed data set are monosynaptic, as shown by one-for-one responses to spikes with a constant latency between the presynaptic spike and the postsynaptic response. In addition, about half of the recordings were made in a high divalent cation solution, which increases spike thresholds, and therefore limits the response of neurons interposed between the stimulated neuron and the neuron whose response is recorded.
Some follower neurons received both fast IPSPs and fast EPSPs from different S1 presynaptic neurons. To rule out the possibility that electrolytes from the electrode leaked into the neuron, thereby flipping the sign of a PSP, we examined whether there was a tendency for changes in the sign of a PSP when a follower was recorded in response to a number of repeated stimuli to different S1 neurons. If an electrode leak affected the sign, as a recording from a follower proceeds, we should see sign reversal. However, we did not see any such tendency.
Statistics
Kruskal–Wallis tests (https://www.socscistatistics.com/tests/kruskal/default.aspx or https://www.statskingdom.com/kruskal-wallis-calculator.html) were used to compare differences in synaptic connectivity among the different postsynaptic followers, and among the four subareas of the S1 cluster. Chi-square tests were used to determine the significance of a decrease or increase in the amplitude of a connection as a result of stimulus repetition (either within trains or between trains), using the null assumption that increases and decreases and the absence of change in amplitude should be equally likely to occur. Chi-square tests were also used to compare the distributions of excitation, inhibition, and lack of a connection, between ganglia from naive and trained animals. Where relevant, P values were corrected for FDR, using an online calculator (https://www.sdmproject.com/utilities/?show=FDR) using the method proposed by Benjamini and Hochberg (1995).
Acknowledgments
We thank Dr. Jeffrey Gill for writing a program that translated the data to a format that was analyzed. This work was funded by U.S.–Israel Binational Science Foundation grant no. 2017624 (to A.J.S.); Israel Science Foundation grant no. 2396/18 (to A.J.S.); U.S. National Institutes of Health (NIH) grant no. 1R01NS118606-01 (to A.J.S. and H.J.C.); the National Natural Science Foundation of China grants no. 32171011, 31861143036, 31671097, and 31371104 (to J.J.); and the U.S. National Science Foundation grant IOS-1754869 (to H.J.C.).
Author contributions: I.H. planned the experiments and supervised them. S.T. gathered the data. A.J.S. analyzed the data, prepared the figures, and wrote the paper. A.J.S., I.H., J.J., and H.J.C. revised the paper. A.J.S., J.J., and H.J.C. obtained funding.
Footnotes
-
[Supplemental material is available for this article.]
-
Article is online at http://www.learnmem.org/cgi/doi/10.1101/lm.053880.123.
- Received September 4, 2023.
- Accepted April 19, 2024.
This article is distributed exclusively by Cold Spring Harbor Laboratory Press for the first 12 months after the full-issue publication date (see http://learnmem.cshlp.org/site/misc/terms.xhtml). After 12 months, it is available under a Creative Commons License (Attribution-NonCommercial 4.0 International), as described at http://creativecommons.org/licenses/by-nc/4.0/.



