


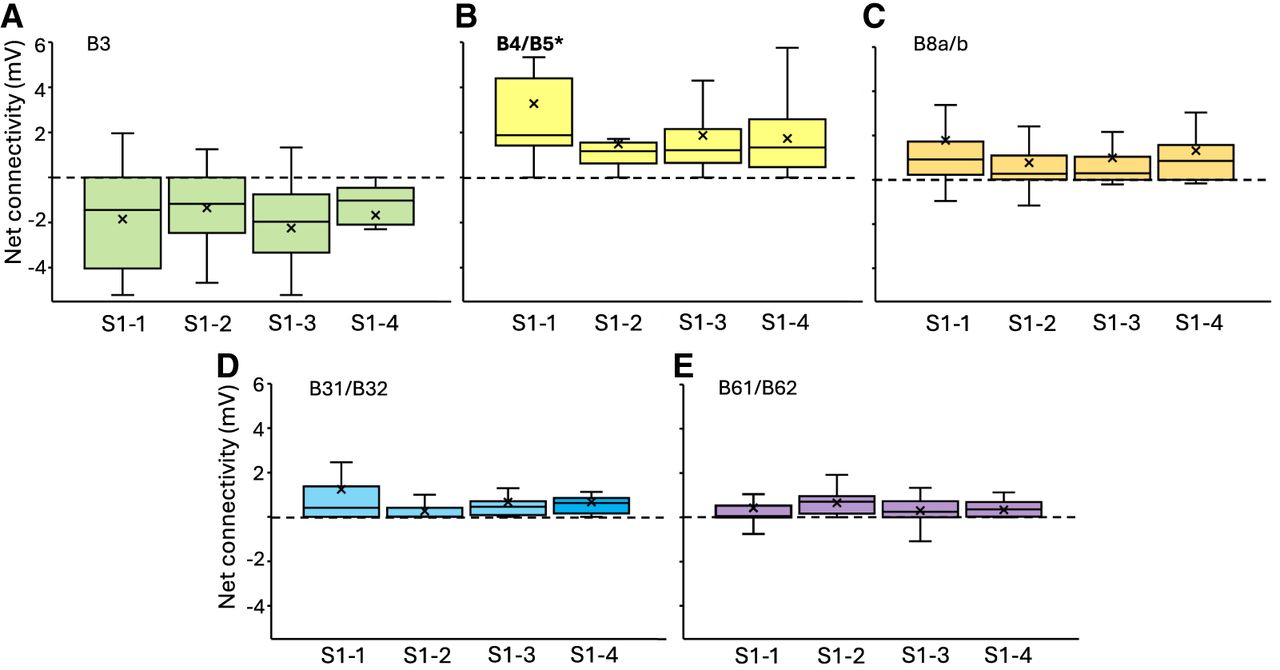
Figure 6.
Net connectivity of fast PSPs from each of four subareas of the S1 cluster, for each of the five follower cells (A–E) in naive animals. Net connectivity (mean of six measures per cell) is shown. Boxes show upper and lower quartiles. The line within the box is the median, and × is the mean. Note that outliers are not shown but were included in all calculations. Dashed line at zero. Only B4/B5 (marked with bold and asterisk) shows a difference in connectivity among the four subareas, with the largest connectivity in S1-1.



