


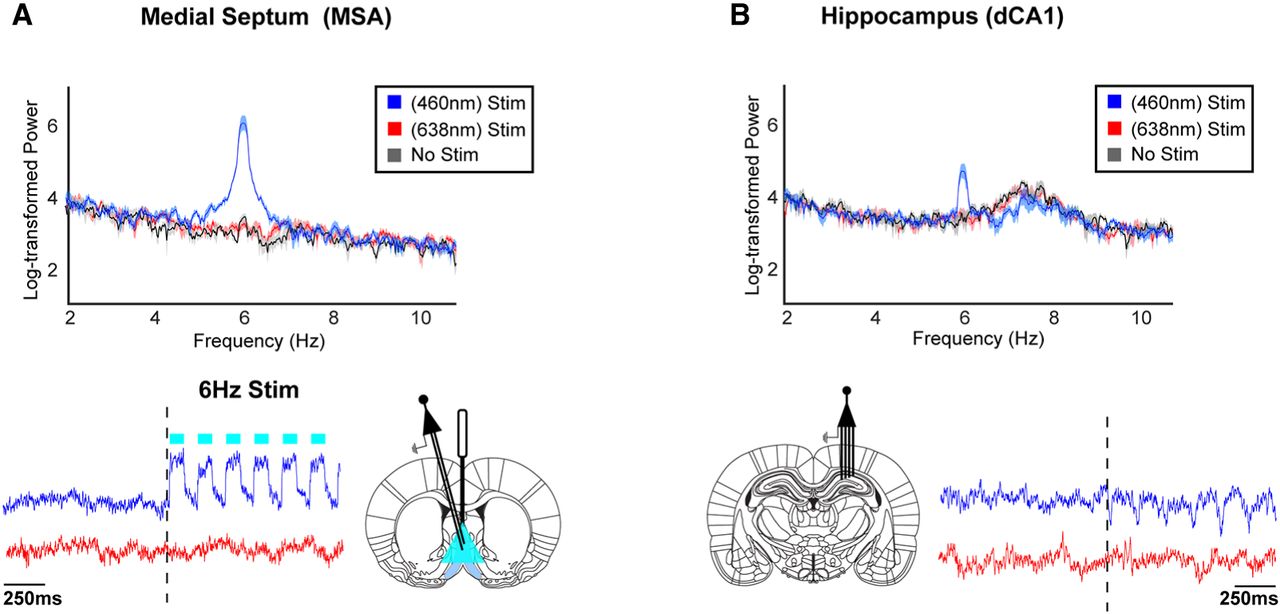
Optogenetically induced theta oscillations in the MSA and dorsal CA1. Top panels show the log-transformed power of MSA (A) and dorsal CA1 (B) LFP during bouts of 460 nm excitatory 6 Hz MSA theta stimulation (blue), 638 nm control stimulation (red), and no stimulation (gray). Stimulation was applied in two rats, each undergoing a single 31 min session with alternating 30 sec on/off cycles. Solid lines show the mean, with shading representing the standard error of the mean (SEM). Notice the large peak at the pulsed frequency of 6 Hz in both brain regions. Bottom panels show example traces of LFP activity from the same rat in response to excitatory versus control 6 Hz MSA theta stimulation for each brain region; cyan bars denote the 6 Hz pulsing paradigm with a 50–50 duty cycle.



