


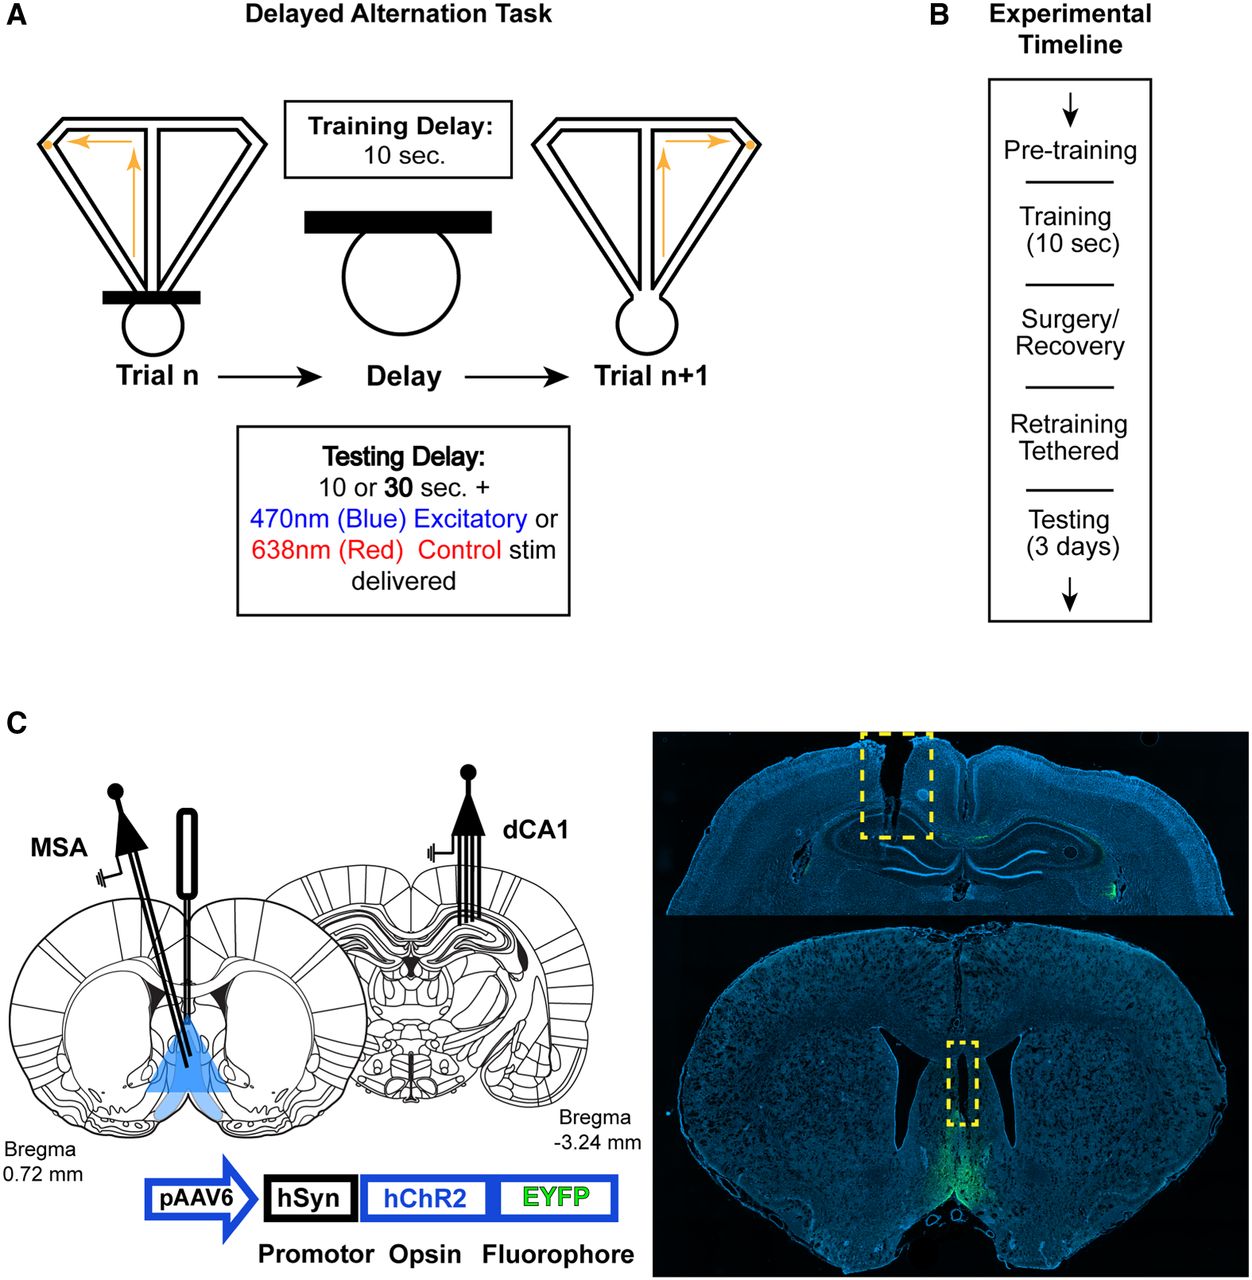
DA task schematic and experimental time line. (A) Schematic of the DA task. Rats alternated visits to the left and right goal arms of a T-maze to receive a food reward at the end of each maze arm. Between trials, the rats were confined to a box at the base of the maze stem for a delay period. The schematic also shows the four trial types that were interleaved within each testing session: 10 versus 30 sec delay and red (control) versus blue (excitatory) laser. On training sessions (before rats reached criterion), rats were given 10 sec delay trials only with no laser stimulation. (B) Brief overview of experimental time line. (C, left) Schematic depicting viral injection into MSA (light blue) along with an optic fiber (emitting blue light over MSA) and electrode array implant. (Bottom) Viral vector composition containing excitatory opsin used for stimulation. (Right) Example histology sections of DAPi-stained coronal slices of MSA and hippocampus. The yellow box in the top image indicates the location of the hippocampal recording array, and the yellow box in the bottom image indicates the location of the optic fiber implant over the MSA. Yellow–green fluorescence represents a localized restriction of viral spread throughout MSA and MSA projecting cells terminating in the dorsal hippocampus.



