


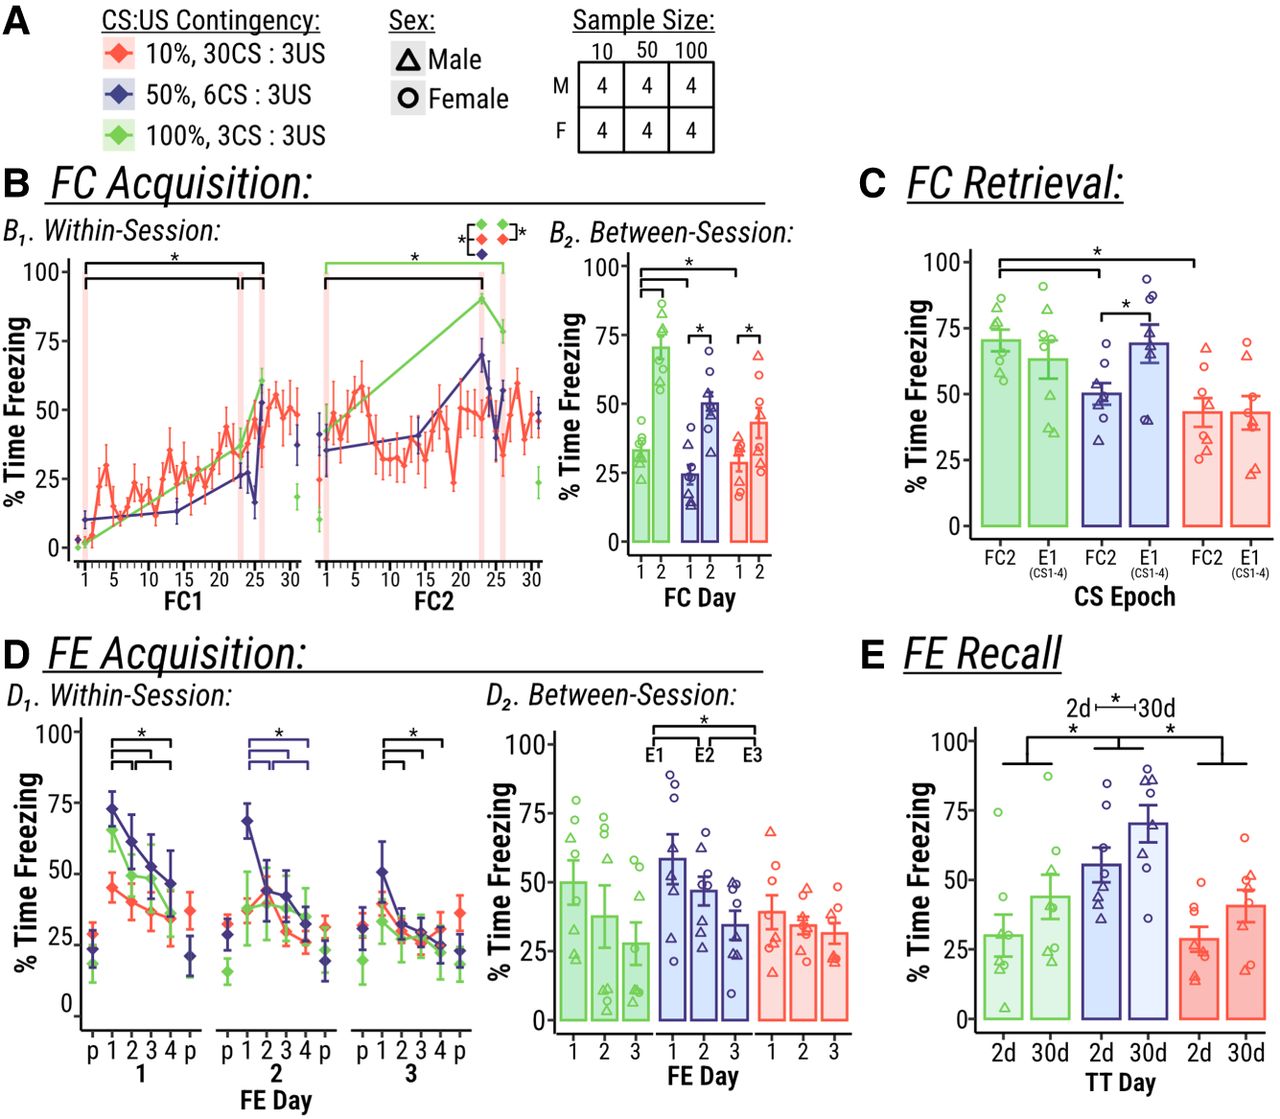
Lower US strength (0.3 mA) and partial reinforcement alter fear learning but do not affect FE. (A) Mice were placed into an FC chamber (context A) across 2 days and received CS-tones that were either paired or unpaired with a 0.30 mA US footshock. One group of mice received consistent reinforcement (100%: 3CS:3US,) while two other groups received partial reinforcement (50%: 6CS:3US; 10%: 30CS:3US). (B1) The effect of partial reinforcement (50%; 10%) on within-session FC acquisition. Conditioned freezing increased across both FC trials (P < 0.001). Partial reinforcement (50% and 10%) led to decreased freezing at CS2 (P < 0.001) and CS3 (P = 0.007) relative to CS1 during FC2. (B2) The effect of partial reinforcement (50%; 10%) on between-session FC acquisition. All conditions displayed increased freezing on FC2 relative to FC1 (P < 0.001). The consistently reinforced (100%) group demonstrated higher levels of freezing on FC2 than partially reinforced group (50%, P = 0.014; 10%, P = 0.001). (C) The effect of partial reinforcement on FC retrieval. 50% reinforcement led to higher levels of freezing during FE1 (CS1–4) than FC2 (P = 0.013). (D1) The effect of partial reinforcement on within-session FE acquisition. On FE1, percent time freezing decreased across CS bin (P < 0.001) without any effect of CS contingency at any CS bin (P > 0.05). On FE2, freezing during CS bin 1 was greater in the 50% reinforcement group than 100% or 10% (P = 0.05). On FE2, the 50% reinforcement group exhibited lower levels of freezing during CS bins 2–4 than CS bin 1 (P < 0.01). On FE3, freezing decreased across bins (P < 0.001), yet contingency had no effect on freezing (P > 0.05). (D2) No effect of partial reinforcement on between-session FE acquisition. Freezing decreased across FE days (P < 0.001). There was no effect of contingency on freezing between FE days (P > 0.05). (E) The effect of reinforcement contingency on FE recall. Conditioned freezing was greater at the 30 days tone test than the 2 day test (P = 0.019). Conditioned freezing was significantly lower for both the 100% (P = 0.002) and 10% (P < 0.001) contingency groups relative to the 50% group. Error bars represent ± SEM. Red shaded regions represent CS–US pairings.



