


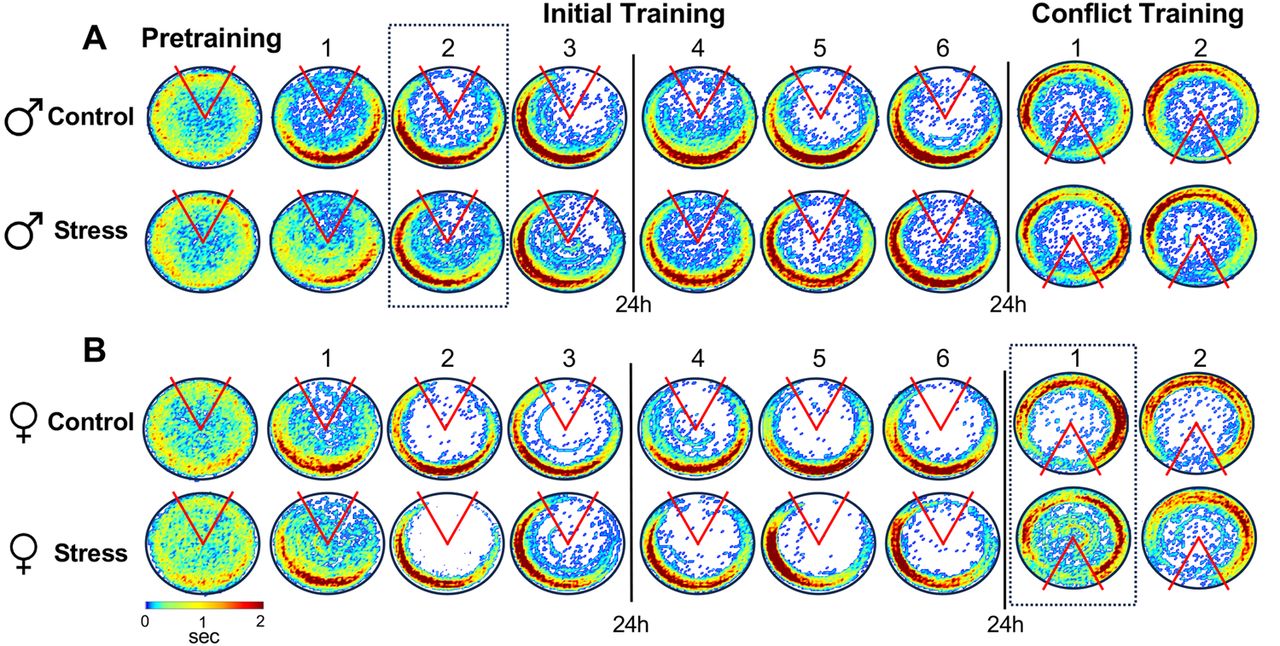
Figure 3.
Social isolation affects patterns of avoidance behavior. Color-coded time-in-location maps for (A) males and (B) females of each group during pretraining, initial training (trials 1–6), and conflict training (trials 1–2). Colors represent group averages during each 10 min trial, with blue indicating the lowest dwell time and red indicating the highest dwell time. The time represented by each color was the same for all maps (color bar, 0–2 sec). Dashed lines indicate trials during which stress increased the number of entrances into the shock zone. n = 9 control males; n = 10 stress males; n = 7 control females; n = 7 stress females.



