


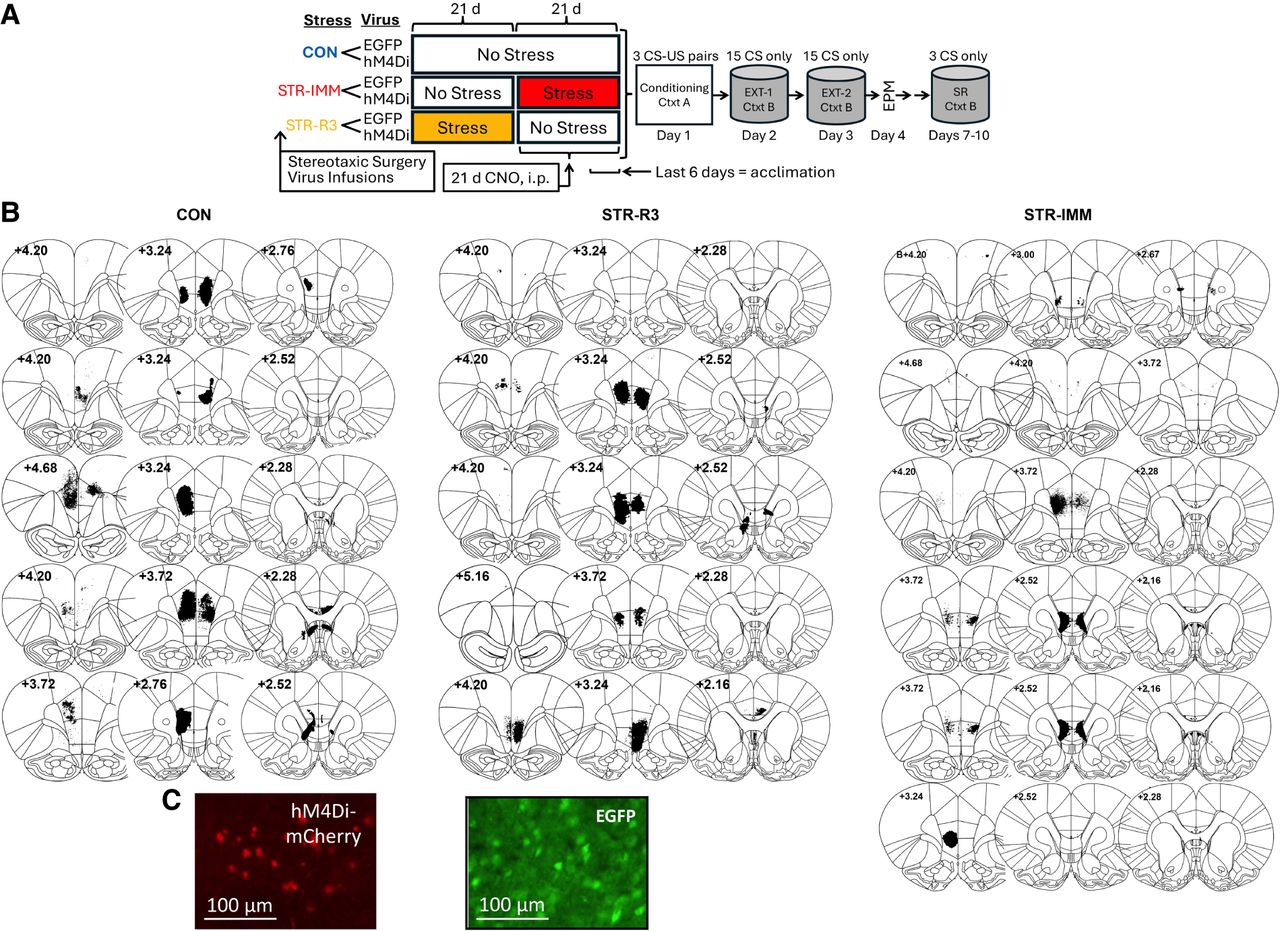
Experimental time line and images. (A) Time line. Rats were assigned to one of three stress groups. Rats in the stress immediate group were chronically stressed and underwent fear conditioning within days after restraint ended (STR-IMM). Rats in the stress-recovery group were chronically stressed and then had 3 weeks without restraint before the start of fear conditioning (STR-R3). The control group did not undergo a stressor manipulation (CON). During the 3-week break for STR-R3, which overlapped with the stressor manipulation for STR-IMM, all rats (CON, STR-IMM, STR-R3) were given daily injections of CNO (1 mg/kg BW, i.p.) for chronic activation of the DREADDs, which were introduced in the IL region of the mPFC via viral infusions before the start of any manipulation. Six days before the start of fear conditioning, rats were acclimated to contexts A and B for 6 days for 10 min per day, alternating between contexts. On the day after the end of the stress manipulation for the STR-IMM cohort and 3 weeks after the end of the stress manipulation for the STR-R3 cohort, CNO administration stopped, and then all rats were fear conditioned in context A with three tone and foot shock pairings. On the subsequent 2 days, rats were placed into context B and were presented with 15 tone-only presentations (no foot shock) for extinction training for a total of 30 tone presentations over 2 days. The day after the second extinction training ended, anxiety-like behavior was measured on the EPM. All rats underwent spontaneous recovery (SR) 4–7 days after the end of extinction training. (CS) Conditioned stimulus (tone), (US) unconditioned stimulus (foot shock). Context A = Ctxt A is denoted by the white box. Context B = Ctxt B is denoted by gray cylinders. (B) Viral expression placement in rats with hM4Di virus. Viral placement was primarily in the IL, but 81% had spread into the PL. Rats were included in subsequent analyses when placement was bilateral and in the IL only, or when placement was bilateral and in the IL with spread to the PL. Please note that the Paxinos and Watson stereotaxic coordinate markers are overlaid on the image to help illustrate brain regions and reflect the histological axis of A/P: +2.7; M/L: +0.5, −0.65; D/V: −5.2 from bregma (Paxinos and Watson 2013). (C) Magnified images. A magnified image showing neurons expressing the inhibitory virus AAV8-CamKIIα-hM4Di-mCherry (left) and the control (CON) virus AAV8-CamKIIα-EGFP (right).



