


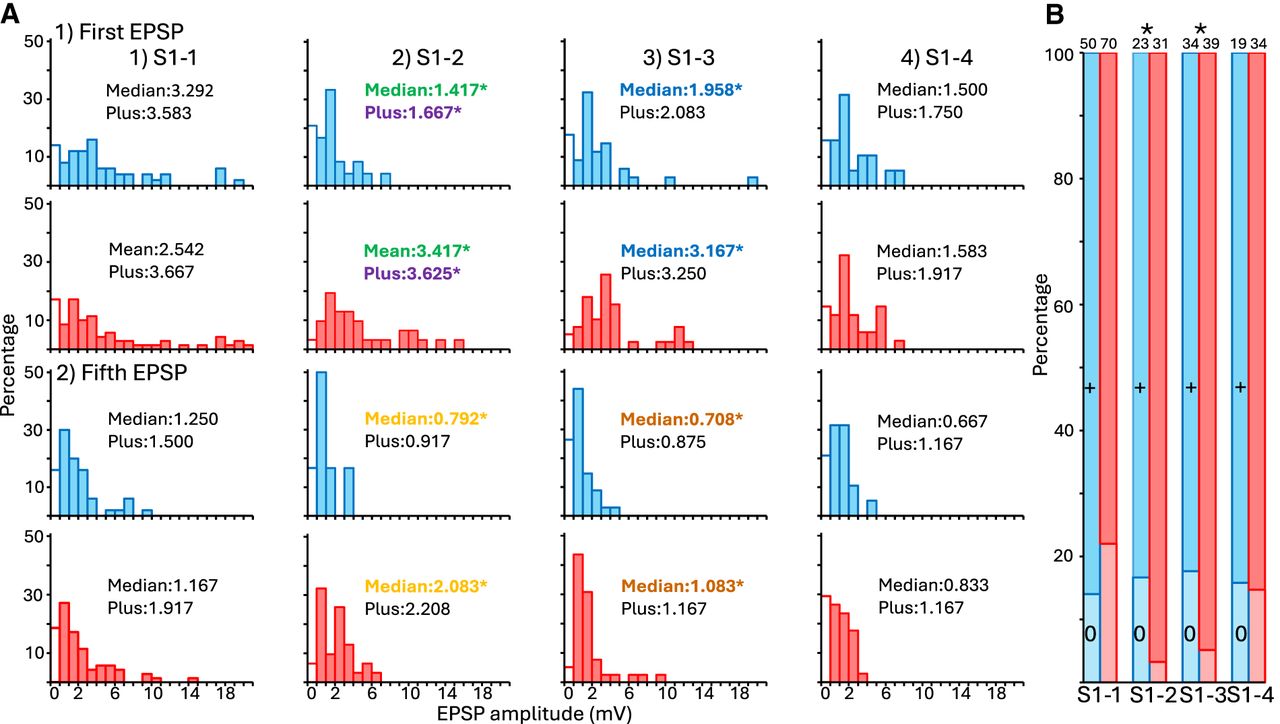
Connectivity to B4/B5 in the four subareas of the S1 cluster. Data are shown separately for ganglia taken from naive animals (blue) and from animals that had learned (red). (A) Distribution of the EPSP amplitudes in the four subareas of the S1 cluster. Data are shown separately for the first EPSP in the three trains, and of the fifth EPSP in the trains. Each graph shows the median amplitudes of all measured connections (median), including zeros (marked by an unfilled bar), and also median amplitudes of the EPSPs (plus), in which unconnected neurons are not included. Median amplitudes of EPSPs are increased after learning in S1-2 and S1-3. These increases are noted by bolded text and color-coded asterisks marking the bolded text. Significant increases in the amplitude of connected cells (plus) were restricted to the first EPSP in S1-2 (color-coded asterisk). (B) Distribution of excitatory connections (+) and unconnected cells (0). The number of connections in each bar is shown above the bar. There are significant decreases in the number of unconnected cells in subareas S1-2 and S1-3 in animals that had learned. Significant changes due to learning are noted by asterisks (see statistics in the text).



