


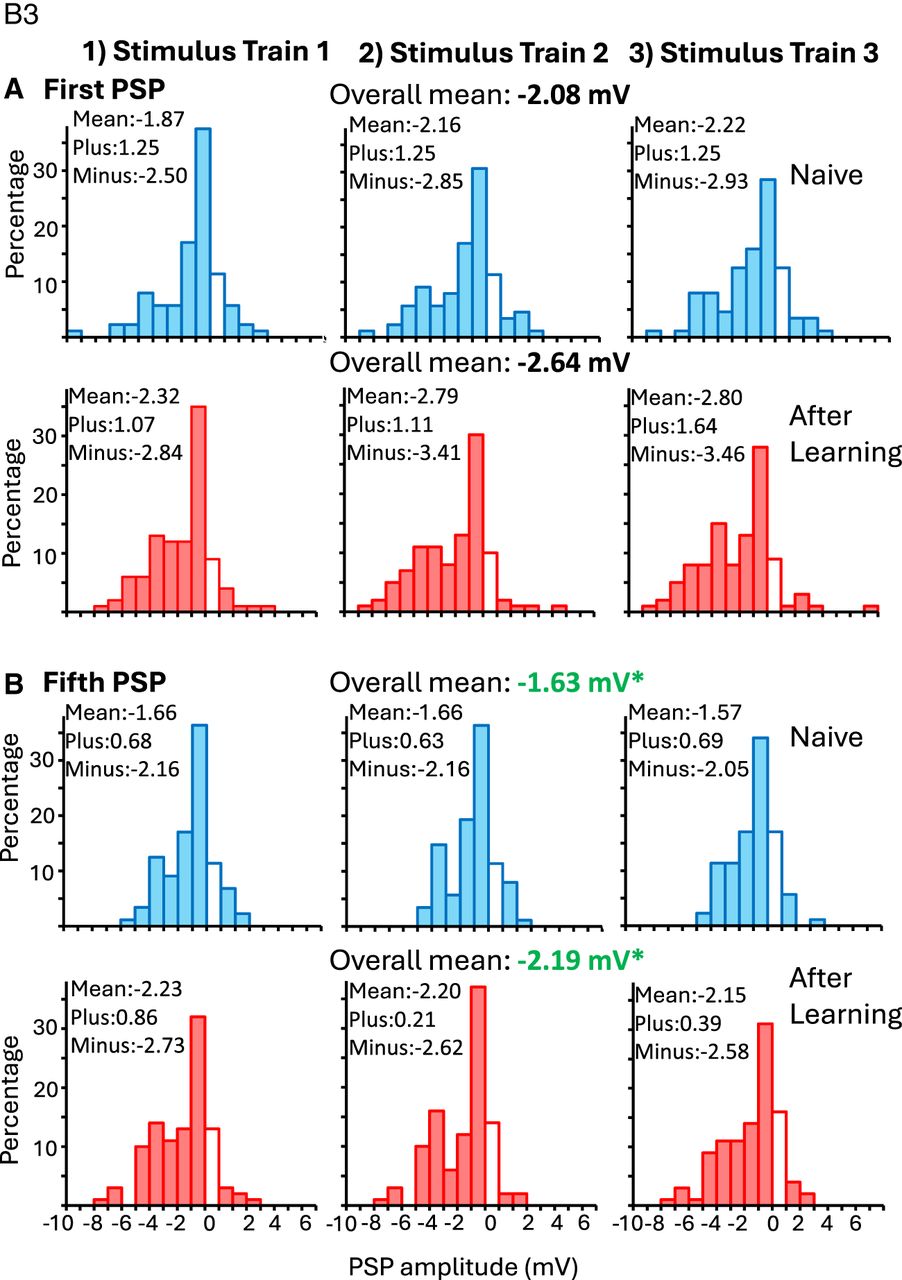
Distribution of fast PSP amplitudes in B3 from S1 neurons. Both EPSPs and IPSPs are present. There is a tendency for inhibition to increase after learning. Data are combined from all four subareas of the S1 cluster. Data are shown separately for the three stimulus trains of five spikes each (Stimulus Train 1, Stimulus Train 2, Stimulus Train 3) and for the first (A) PSP in a stimulus train and for the fifth (B) PSP in a stimulus train. Data are also shown separately for naive animals (blue) and for animals that had learned (red). The lack of a connection (PSP amplitude of zero) is indicated by an unshaded bar. In the upper left-hand corner of each histogram are shown the mean amplitudes of all measured PSPs including zeros, and also the mean amplitudes of the EPSPs (Plus) and of the IPSPs (Minus). Asterisks show a significant difference between naive animals and animals that had learned only for the fifth PSP (see the t-tests within the text). The overall means shown are the mean of all three measurements in the first or the fifth PSP elicited in a stimulus train. N = 88 connections were sampled in 14 preparations from naive animals, and N = 103 connections were sampled in 10 preparations from animals that had learned.



