


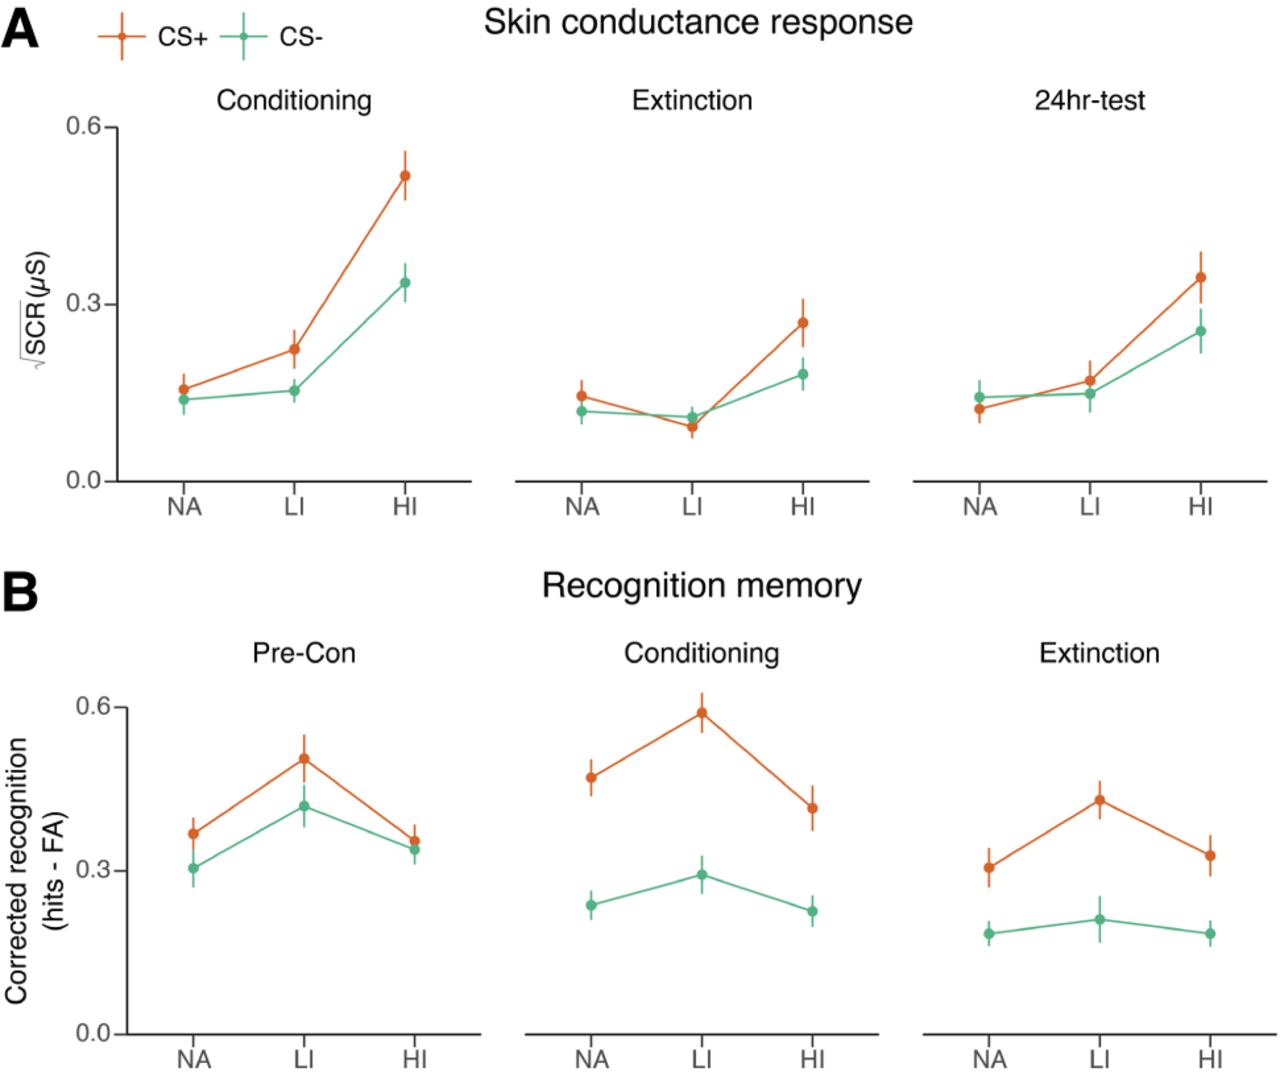
Figure 8.
Effect of US intensity on SCR and corrected recognition. Figures representing the (A) linear and (B) inverted U-shaped relationship between US intensity and the arousal/selected memory enhancement. In (A), points denote participant average SCR during three phases. In (B), points denote participant average corrected recognition (hits − FA) for images encoded during three phases. Error bar denotes 95% CI from the data. Lines connect the mean to demonstrate trend.



