


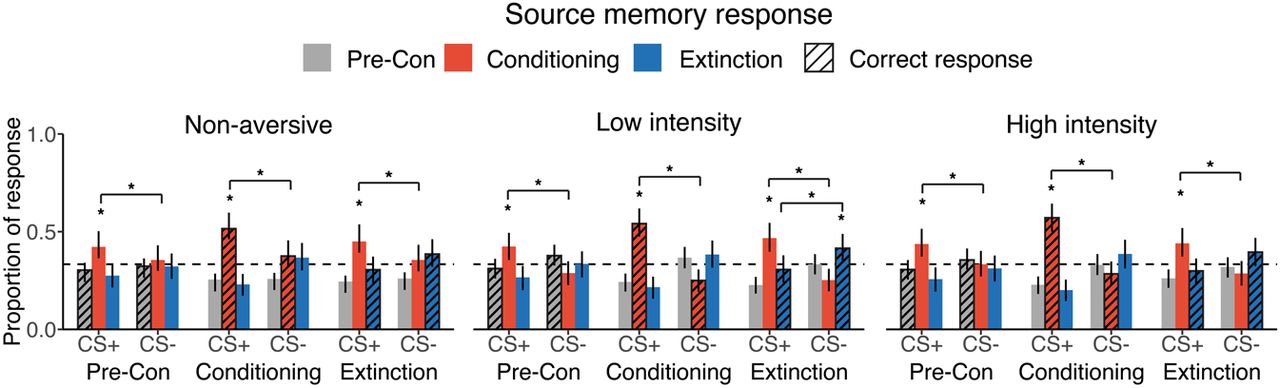
Figure 5.
All three groups demonstrated a bias to endorse a CS+ as seen during conditioning, regardless of when it was actually encoded. Correct source memory response is marked by hatched bars and black outlines. Responses are shown as the proportion of items for each CS type and encoded in each temporal context (1.0 = 24 items). Bars and error bars denote the average proportion of item attributed to each context and 95% HDI of the posterior distribution of probability. Dashed line indicates chance level (1/3). (*) 95% HDI is above 1/3.



