


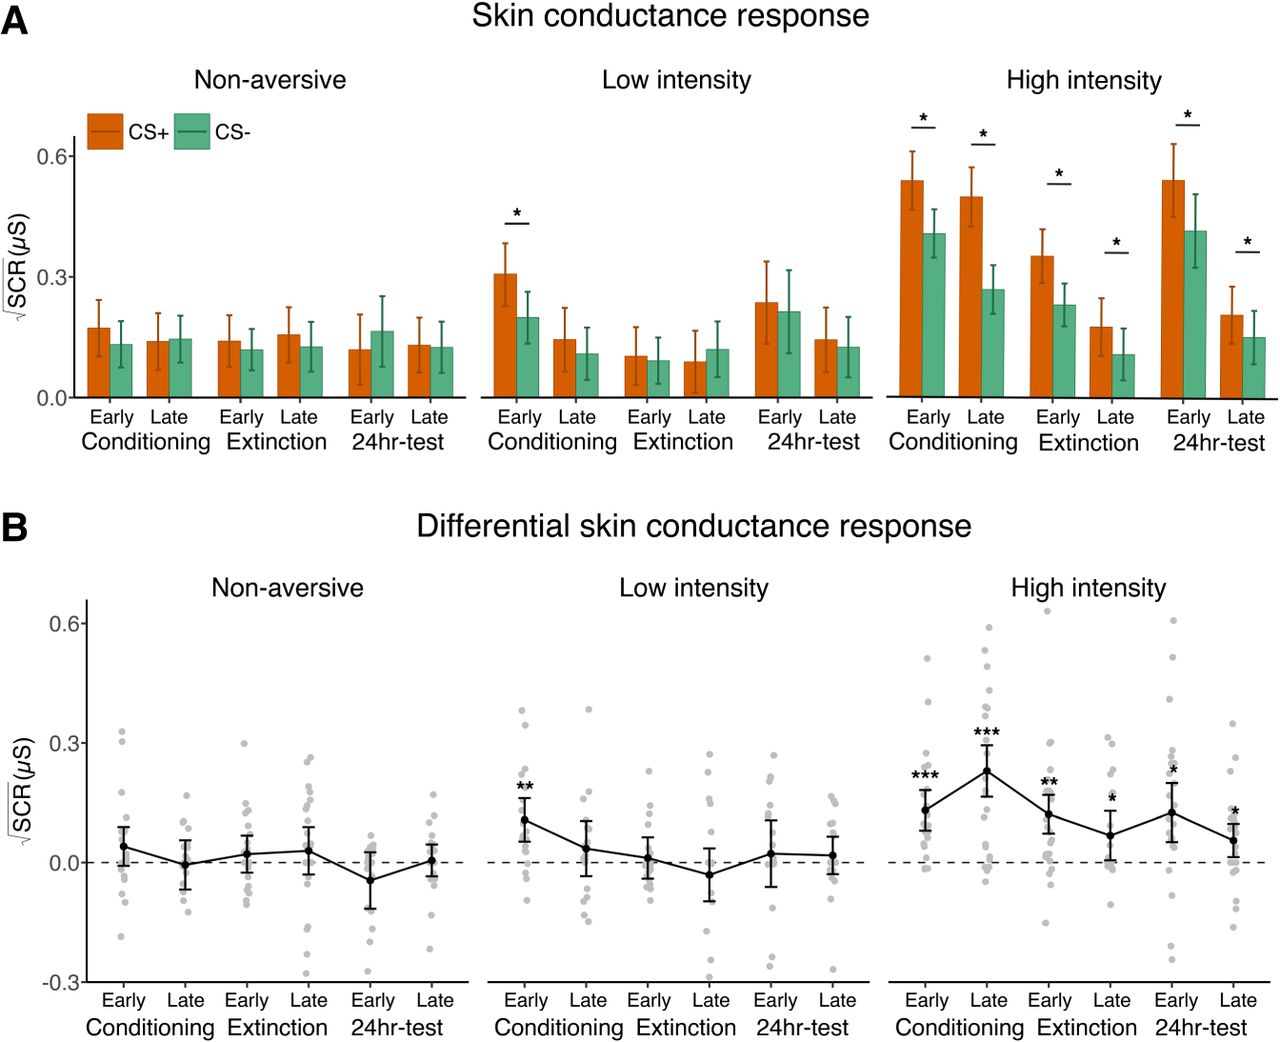
Square-root transformed SCR. For trial-by-trial SCR data, see Supplemental Figure S2. Bars and error bars denote mean and 95% CI from planned comparison. (A) SCR to both CS+ and CS− remained high in the HI group. LI showed higher SCR during early conditioning and test than NA group. (B) HI group maintained differential arousal (CS+–CS− > 0) during all three phases. LI group only showed differential arousal during early acquisition, while NA group never showed discrimination. Dashed line indicates no difference. Gray points denote trial-averaged data of individual subjects. Black lines connect the mean of early and late time points of each phase to demonstrate the trend. (*) P < 0.05, (**) P < 0.01, (***) P < 0.001.



