


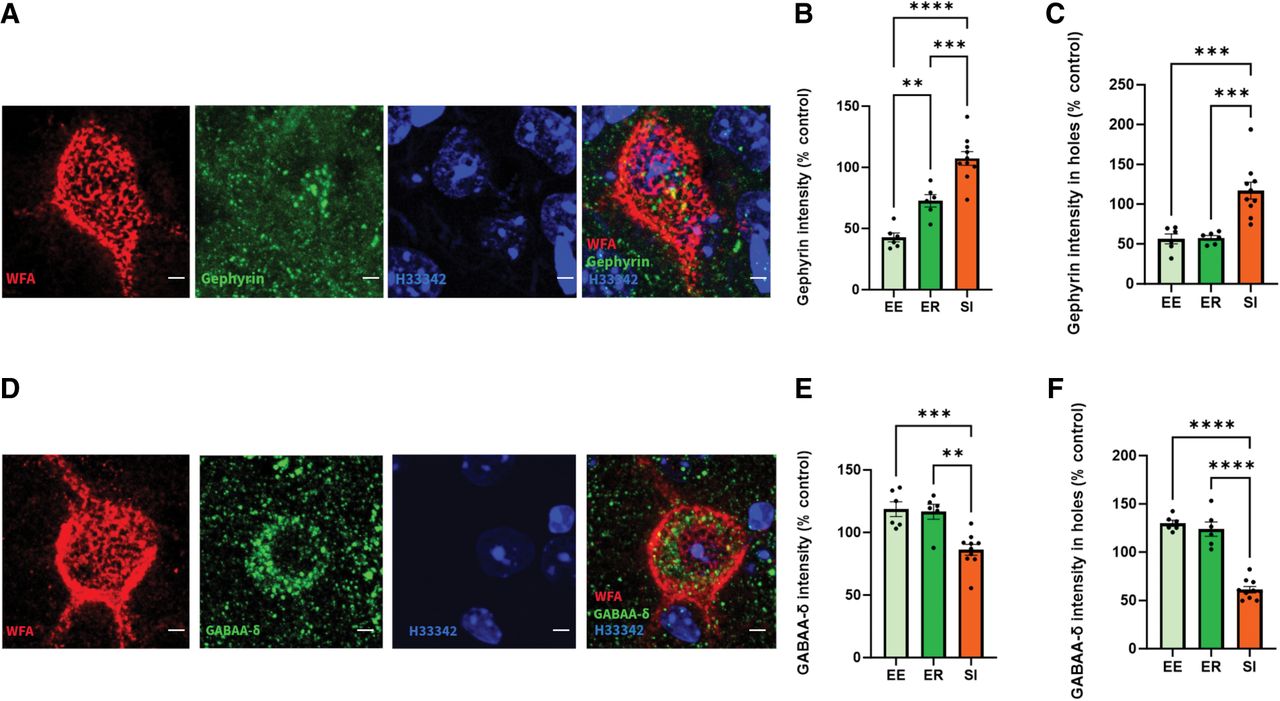
Social and nonsocial loss alter expression of GABAA receptor markers and alter their concentration within PNN holes in the vCA1. (A) Confocal image of WFA+ Gephyrin+ cell in vCA1. (B) Higher gephyrin intensity represented as percent control is observed in the SI group compared to EE and ER group. (C) Higher gephyrin intensity in holes, represented as percent control, was observed in the SI group compared to EE and ER. (D) Confocal image of WFA+ GABAA-δ+ cell in vCA1. (E) Overall GABAA-δ intensity, when considered as percent control, showed no differences between the EE and ER groups but a difference in the SI group compared to both the EE and ER groups. (F) Lower GABAA-δ intensity in PNN holes was observed in the SI group compared to EE and ER. No difference in GABAA-δ intensity in PNN holes was observed between the EE and ER groups. Data are mean ± SEM (EE n = 6, ER n = 6, SI n = 10). Significance is denoted as P-values: (*) P < 0.05, (**) P < 0.01, (***) P < 0.001, (****) P < 0.0001. See Table 1 for complete statistics. (EE) Environmental enrichment, (ER) enrichment removal, (SI) social isolation, (GABAA-δ) gamma-aminobutyric acid receptor subunit δ, (WFA) Wisteria floribunda agglutinin, (H33342) Hoechst 33342. Scale bars, 5 μm (A,D).



