


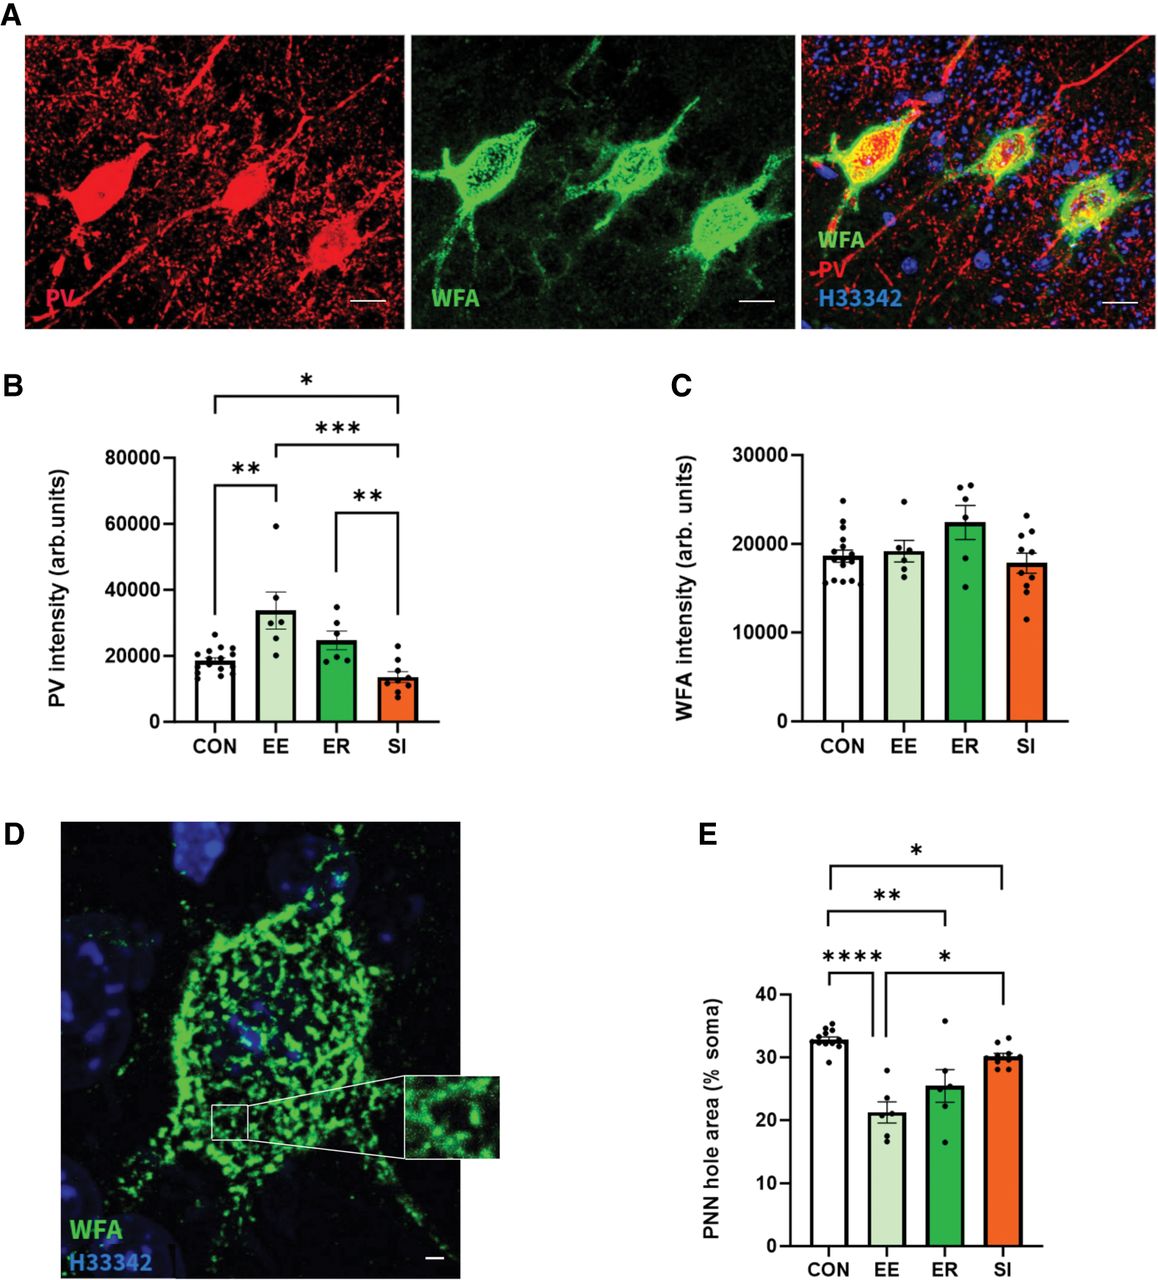
Social and nonsocial loss decreases the percentage of PNN occupied by holes in the vCA1. (A) Confocal image of PV+/WFA+ cells in vCA1. (B) EE mice show a higher PV intensity compared to CON, while SI mice have significantly lower PV intensity compared to CON mice. No differences were observed between ER and CON groups. (C) No differences in WFA intensity were observed across groups. (D) Confocal image of WFA+ cell in vCA1. (E) Decrease in percentage of WFA area covered by holes is observed in all groups compared to CON. Data are presented as mean ± SEM (CON n = 16, EE n = 6, ER n = 6, SI n = 9–10). Significance is denoted as adjusted P-values after FDR post hoc tests: (*) P < 0.05, (**) P < 0.01, (***) P < 0.001, (****) P < 0.0001. See Table 1 for complete statistics. (CON) Control, (EE) environmental enrichment, (ER) enrichment removal, (SI) social isolation, (PNN) perineuronal net, (PV) parvalbumin, (WFA) Wisteria floribunda agglutinin, (H33342) Hoechst 33342. Scale bars, 20 μm (A), 5 μm (D).



