


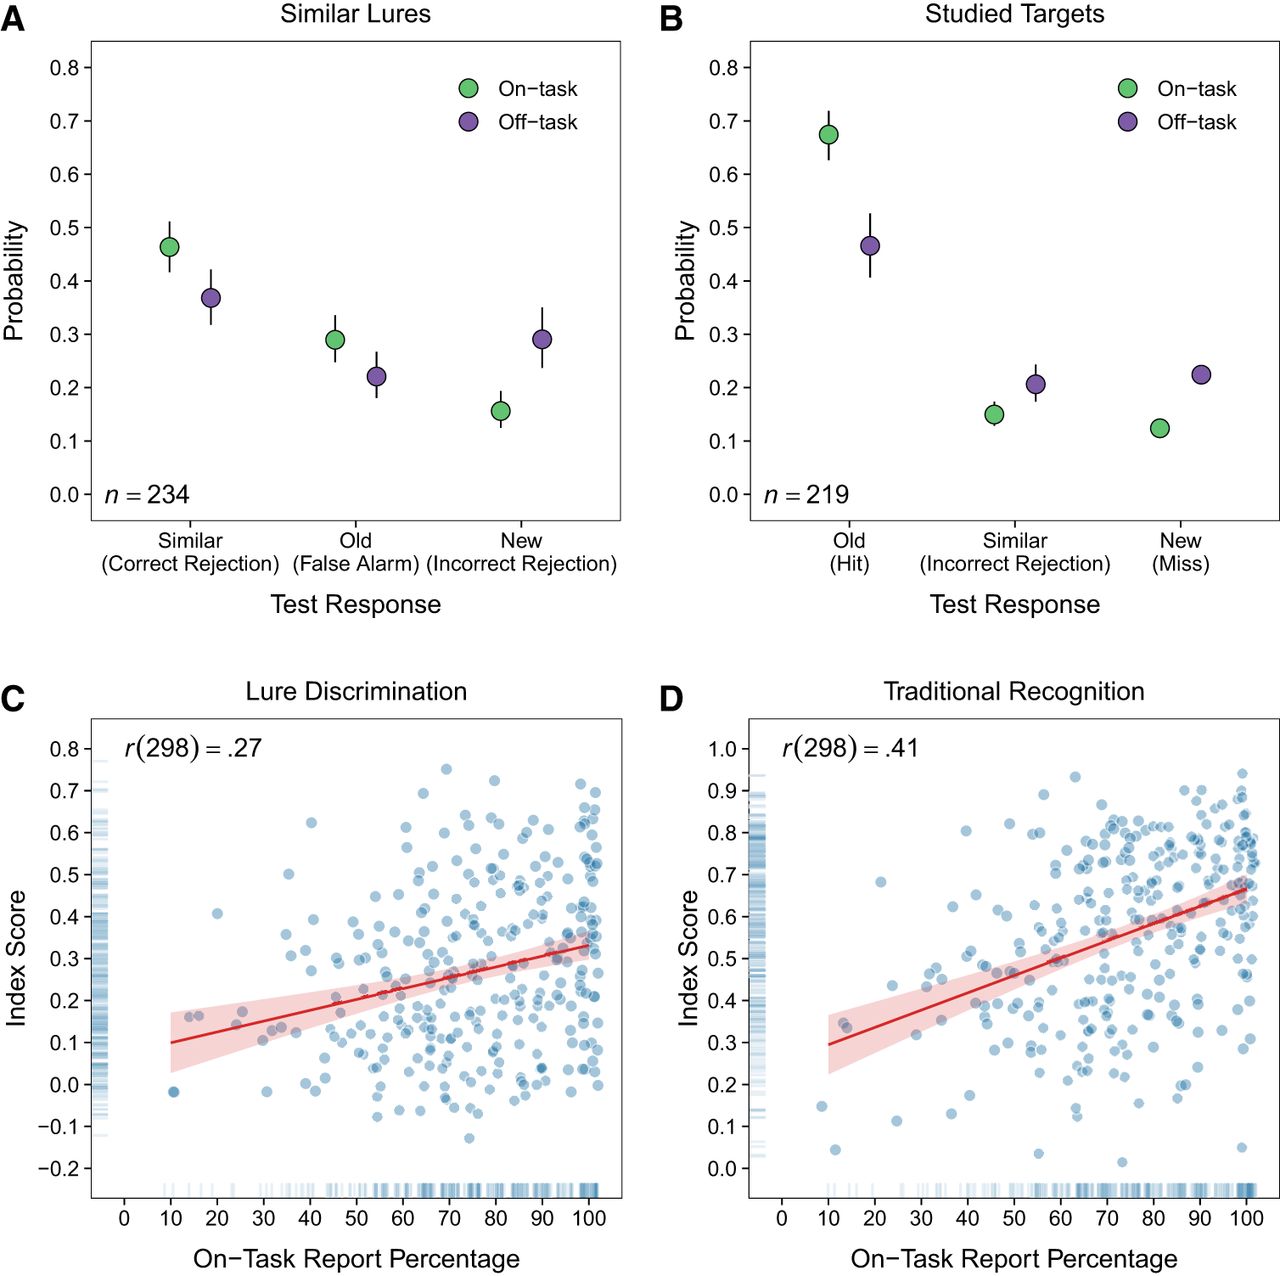
Figure 3.
(A,B) Test response classification probabilities for similar lures (A) and studied targets (B) based on whether participants reported being on task or off task after seeing the corresponding object during the study phase. (C,D) Scatter plots depicting associations between the percentages of on-task reports during study and index scores for lure discrimination (similar lures) (C) and traditional recognition (studied targets) (D). Error bars (A,B) and shaded regions (C,D) are 95% confidence intervals. The rugs in C and D indicate the frequency distributions for each measure.



