


Figure 2.
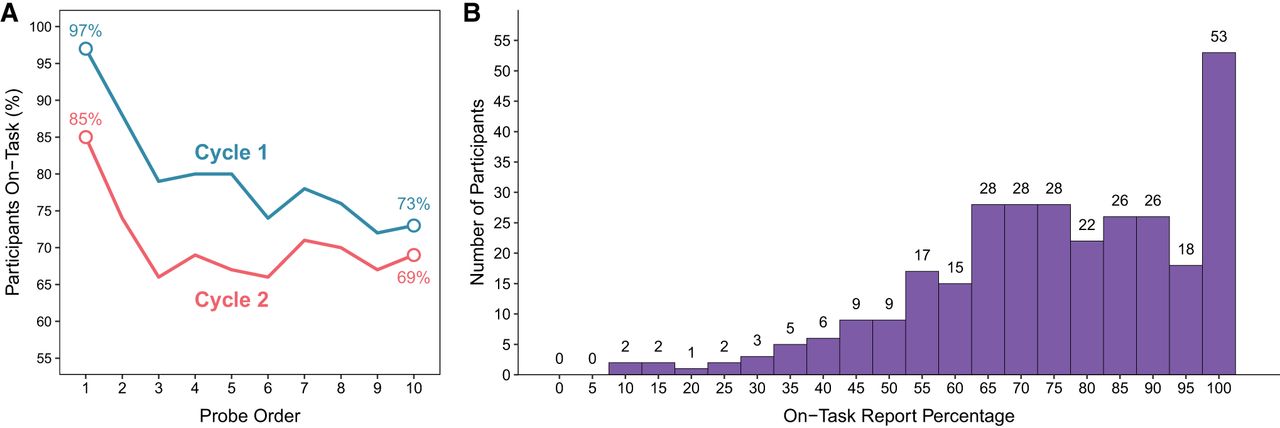
(A) The percentages of participants that reported being on-task conditioned on thought probe order and study–test cycle. (B) The frequency distribution of overall on-task report percentages across participants.
(Downloading may take up to 30 seconds. If the slide opens in your browser, select File -> Save As to save it.)
Click on image to view larger version.
(A) The percentages of participants that reported being on-task conditioned on thought probe order and study–test cycle. (B) The frequency distribution of overall on-task report percentages across participants.
 CiteULike
 Delicious
 Digg
Digg Facebook
 Reddit
 Twitter
