


Cue predictiveness and uncertainty determine cue representation during visual statistical learning
- 1Academic Unit of Human Communication, Development, and Information Sciences, Faculty of Education, The University of Hong Kong, Hong Kong 999077, China
- 2Department of Psychology and Behavioral Sciences, Zhejiang University, Hangzhou, Zhejiang 310000, China
- Corresponding authors: xltong{at}hku.hk, chenhui{at}zju.edu.cn
Abstract
This study investigated how humans process probabilistic-associated information when encountering varying levels of uncertainty during implicit visual statistical learning. A novel probabilistic cueing validation paradigm was developed to probe the representation of cues with high (75% probability), medium (50%), low (25%), or zero levels of predictiveness in response to preceding targets that appeared with high (75%), medium (50%), or low (25%) transitional probabilities (TPs). Experiments 1 and 2 demonstrated a significant negative association between cue probe identification accuracy and cue predictiveness when these cues appeared after high-TP but not medium-TP or low-TP targets, establishing exploration-like cue processing triggered by lower-uncertainty rather than high-uncertainty inputs. Experiment 3 ruled out the confounding factor of probe repetition and extended this finding by demonstrating (1) enhanced representation of low-predictive and zero-predictive but not high-predictive cues across blocks after high-TP targets and (2) enhanced representation of high-predictive but not low-predictive and zero-predictive cues across blocks after low-TP targets for learners who exhibited above-chance awareness of cue–target transition. These results suggest that during implicit statistical learning, input characteristics alter cue-processing mechanisms, such that exploration-like and exploitation-like mechanisms are triggered by lower-uncertainty and higher-uncertainty cue–target sequences, respectively.
When walking on the beach, we see boats more often than cars. When crossing a city street, we are more likely to see cars than boats. Thus, the prediction of beach to boats is high, while the prediction of a city street to boats is low. Such variation in the level of cue predictiveness (e.g., beach or city street) of the occurrence of an object (e.g., boat or car) can influence the cognitive processing of cues through exploitation or exploration mechanisms in many explicit associative learning tasks that require participants to determine the predictive relationships between cues and outcomes (e.g., Beesley et al. 2015). Meanwhile, increasing evidence shows that statistical learning (i.e., the involuntary extraction of environmental patterns) (Batterink et al. 2019; Christiansen 2019) is subserved by multiple neurocognitive mechanisms whose involvement is regulated by input uncertainty (Conway 2020; Tong et al. 2023). However, whether input uncertainty regulates the operation of different cue-processing mechanisms (i.e., exploitation and exploration) during statistical learning remains unknown. To address this issue, the present study used a novel probabilistic cueing validation paradigm to examine the impacts of cue predictiveness on cue representation when objects appear with different transitional probabilities (TPs) during visual statistical learning.
To date, two mechanisms—exploitation and exploration—have been proposed to explain two opposite patterns of cue processing with different levels of cue predictiveness (Beesley et al. 2015). Specifically, the exploitation mechanism posits that more cognitive resources are allocated to higher-predictive cues than lower-predictive cues because higher ones are more reliable for anticipating subsequent events (Mackintosh 1975). For example, in an explicit, cue–outcome associative learning study, Le Pelley et al. (2011) instructed participants to learn the associative predictions between cue compounds and two outcome sounds (i.e., O1 or O2). Each cue compound (e.g., AX) comprised one predictive cue (e.g., A = appeared before a specific outcome 100% of the time) and one nonpredictive cue (e.g., X = appeared before O1 and O2 50% of the time each). Eye movement results demonstrated longer dwell times on predictive cues than nonpredictive ones, which indicates greater overt attention on higher-predictive cues, suggesting that humans exploit learned cue predictiveness when making predictions.
In contrast, the exploration mechanism assumes that less-predictive cues attract more cognitive resources than high-predictive cues because increased sensitivity to unlearned rules over perfectly acquired ones promotes a comprehensive understanding of the whole system (Pearce and Hall 1980). For example, using a similar associative learning paradigm, Hogarth et al. (2008) assigned three types of cue compounds (i.e., AX+, BX+/−, and CX−) to predict the presence or absence of an auditory outcome. Each cue compound comprised one control cue (i.e., X) and one predictive cue (i.e., A+, B+/−, or C−) that anticipated the outcome either congruently (i.e., A+ = 100% ahead of present outcomes and C− = 100% ahead of absent outcomes) or incongruently (i.e., B+/− = 50% ahead of present outcomes and 50% ahead of absent outcomes). The results demonstrated a significantly larger difference in viewing time between predictive and control cues in incongruent cue compounds (i.e., BX+/−) compared with congruent cue compounds (i.e., AX+ and CX−), indicating greater attention to lower-predictive cues rather than higher-predictive cues, thereby supporting the exploration mechanism.
More recently, Beesley et al. (2015) integrated the manipulations from previous studies and demonstrated that both attentional exploration between cue compounds and attentional exploitation within cue compounds occurred in the same experiment. For their study, each cue compound (e.g., AX or BY) comprised one nonpredictive cue (e.g., X or Y) and one predictive cue (e.g., A or B) that appeared ahead of outcomes at a higher (e.g., A = 100% ahead of one outcome) or lower (e.g., B = 70% ahead of one outcome and 30% ahead of the other) consistency. The results demonstrated a longer fixation time on the cues in less-consistent cue compounds (i.e., BY) compared with those in consistent cue compounds (i.e., AX), indicating attentional exploration on the cue providing invalid predictions. However, during the follow-up training stage when learning new associative predictions between these cues and novel outcomes, participants demonstrated attentional exploitation by spending more time viewing prior predictive cues (e.g., A and B) than prior nonpredictive cues (e.g., X and Y).
Furthermore, other studies demonstrated that in addition to the period before outcome occurrences, cue processing after outcomes is also influenced by exploration or exploitation mechanisms. For example, Don et al. (2019) manipulated the outcome's frequency (i.e., common [appeared in 75% of trials] and rare [appeared in 25% of trials]) and examined its impacts on attentional bias toward imperfect cues (i.e., predicted both common and rare outcomes) and perfect cues (i.e., always predicted one specific outcome). The results demonstrated that the fixation time difference between perfect and imperfect cues was higher when comparing rare outcomes with common outcomes, suggesting enhanced exploitation cue processing after less-frequent outcomes. These findings point to the plausibility that the characteristics of learning exemplars, such as frequency, may influence subsequent cue-processing mechanisms when participants are explicitly instructed to learn the associative regularities.
Unlike explicit associative learning, humans can incidentally acquire underlying associative patterns among sensory inputs (Thiessen 2017). This ability, termed statistical learning, has been recognized as a composite of multiple memory and cognitive processes whose activations are regulated by input characteristics, such as uncertainty (Conway 2020; Lee et al. 2022). For example, in a positional regularity learning experiment, Tong et al. (2023) demonstrated that compared with low-consistency (60%) pseudocharacters, high-consistency (100%) ones elicited a lower N170 component but a higher P1 component, suggesting that input uncertainty influences the engagement of a neural adaptation process and attentional processing during statistical learning. However, the neural response differences observed between high- and low-uncertainty inputs cannot indicate which mechanism is particularly associated with higher- or lower-uncertainty inputs (Feuerriegel et al. 2021). For example, the attenuated N170 component elicited by high-consistency compared with low-consistency pseudocharacters could be interpreted as either an adaptation process associated with low-uncertainty inputs or enhanced processing triggered by high-uncertainty inputs.
The exploitation versus exploration cue-processing mechanism provides a unique avenue to investigate the specific cognitive mechanisms triggered by higher or lower uncertainty. This can be empirically tested by analyzing how cue-processing patterns change in relation to preceding input uncertainty during statistical learning. Current statistical learning evidence suggests the potential existence of exploitation-like and exploration-like cue processing before outcome occurrences (Beesley and Le Pelley 2010; Zhao et al. 2013; Forest et al. 2022). For example, in visual statistical learning experiments (Jost et al. 2015; Singh et al. 2018), participants were asked to respond as quickly and accurately as possible to a target color that appeared after different visual cues in high (90%), low (20%), or zero probabilities. The high-probability cues elicited a larger P300-like amplitude compared with low- and zero-probability cues, which could be viewed as an exploitation of cue–target associative regularities for effective target detection. Conversely, as observed in an fMRI study (Sherman and Turk-Browne 2020), exploration-like cue processing could be implied by weaker memory encoding of predictive cue images than nonpredictive cue images. However, to date, there is no research examining the questions of whether exploitation-like and exploration-like cue processing can simultaneously exist in statistical learning and, if so, which factor determines the activation of these two mechanisms. Based on the multiple mechanism view of statistical learning (Conway 2020; Tong et al. 2023) and previous empirical findings (e.g., Jost et al. 2015; Singh et al. 2018; Sherman and Turk-Browne 2020), we hypothesize that exploitation-like and exploration-like cue processing coexist during statistical learning, and its operation is regulated by input uncertainty.
To test our hypotheses, we developed a novel probabilistic cueing validation paradigm derived from previous visual statistical learning tasks (Jost et al. 2015; Sherman and Turk-Browne 2020). Our aim was to explore the representation patterns of predictive cues specifically in response to the preceding targets with varying levels of transitional probabilities (TPs). In experiment 1, we manipulated the probability of a specific target (target X or target M) following a given cue into three distinct levels: high (75%), medium (50%), and low (25%), as shown in Figure 1A. As illustrated in Figure 1B, participants performed a target detection task in which they identified two targets by pressing the corresponding keys. A higher accuracy rate and faster reaction time on detecting higher-TP compared with lower-TP targets would indicate successful statistical learning, which suggests that learners could anticipate the following stimuli based on the acquired cue–target associative patterns.
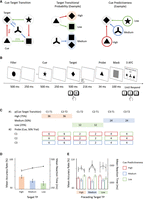
Schematic of experiment 1. (A) The transitional probability (TP) of targets (i.e., high [75%], medium [50%], and low [25%]) was decided by the conditional probability of each target following a cue. In terms of individual targets, the predictiveness of cues (i.e., high [75%], medium [50%], and low [25%]) was determined by the levels of probability in which the cue predicted that target. (B) An example trial with a low-TP target and a probe examining the representation of a high-predictive cue. (3AFC) Three-alternative forced choices. (C) The distribution of trial numbers in different preceding target TP ([red shading] high, [blue shading] medium, [green shading] low) and cue predictiveness ([red border] high, [blue border] medium, [green border] low) conditions for each block. (D) Mean accuracy rates (bar chart) and mean reaction times (line chart) for detecting high-TP, medium-TP, and low-TP targets in the target detection task. Error bars indicate standard errors. (E) Mean accuracy rates (bar chart) and mean reaction times (line chart) for identifying high-predictive cue, medium-predictive cue, and low-predictive cue probes after high-TP, medium-TP, and low-TP targets in the probe identification task. Error bars indicate standard errors.
As shown in Figure 1B, after high-TP, medium-TP, and low-TP targets, a probe was presented to examine the representation of various predictive cues whose shapes predicted the preceding targets with high (75%), medium (50%), or low (25%) probability. Participants were asked to identify the shape of the probes. The probe identification accuracy rates indexed the strength of cue representation. Through the positive or negative impact of cue predictiveness on cue representation, exploitation-like or exploration-like cue processing was inferred. Given that the previous evidence suggests enhanced exploitation cue processing after less-frequent outcomes (Don et al. 2019), we expected (1) a positive association between cue predictiveness and cue representation after low-TP targets, suggesting an exploitation-like cue processing after high-uncertainty inputs, and (2) a negative association between cue predictiveness and cue representation after high-TP targets, indicating an exploration-like cue processing after low-uncertainty inputs.
Results
Experiment 1
Target detection
Figure 1D shows the mean accuracy rates and reaction times (RTs) for detecting high-TP, medium-TP, and low-TP targets in the target detection task (the exact descriptive statistics are also in the Supplemental Material). As summarized in Table 1, the mixed-effect logistic regression model for target detection accuracy [AIC = 15,715, R2 = 0.17, χ²(3) = 522.98, P < 0.001] and the mixed-effect linear regression model for RTs [AIC = 94,674, R2 = 0.26, χ²(3) = 800.05, P < 0.001] significantly outperformed the null model (AICaccuracy = 16,232, AICRT = 95,468). Significant interaction effects between target TPs and blocks are shown for both accuracy (β = 0.39, 95% CI [0.16, 0.63], P = 0.001) and RTs (β = −23.68, 95% CI [−30.62, −16.74], P < 0.001). The estimated marginal effects revealed that the increase of target TPs improved the odds of accurately detecting the target (Ps < 0.001) and reduced the RTs (Ps < 0.001) of target detection across all three blocks. These results indicate that participants were able to learn the association between cues and targets through various TPs.
Mixed-effect regression models for target detection accuracy and reaction time in experiment 1 with target TP and blocks as predictors
Probe identification
Figure 1E depicts mean accuracy rates and RTs for identifying high-predictive, medium-predictive, and low-predictive cue probes after varying levels of TP targets in the probe identification task (the exact descriptive statistics are also in the Supplemental Material). Table 2 summarizes the results of the mixed-effect logistic regression model for probe identification accuracy [AIC = 5895, R2 = 0.25, χ²(7) = 83.13, P < 0.001], which outperformed the null model (AIC = 5964). The interaction effect between the preceding target TP and cue predictiveness (β = −2.46, 95% CI [−4.16, −0.75], P = 0.005) was significant. The marginal effect estimation revealed that the increase of cue predictiveness reduced the odds of accurately identifying probes only when the preceding target TP was high (P < 0.001) but not medium (P = 0.334) or low (P = 0.181). Similarly, the mixed-effect linear regression model (AIC = 89,920, R2 = 0.16) on probe identification RT significantly outperformed the null model [AIC = 90,138, χ²(7) = 232.12, P < 0.001]. However, no significant main effects or interaction effects were found (Ps > 0.05). These results indicate that high-TP but not lower-TP targets triggered exploration-like cue processing.
Mixed-effect regression models for probe identification accuracy and reaction time in experiment 1 with preceding target TP, cue predictiveness, and blocks as predictors
Summary
Our experiment 1 results showed that individuals detected higher-TP targets more accurately and rapidly than low-TP targets, suggesting that people were able to not only extract the underlying patterns from environmental exposure but also use the learned association to guide their motor responses (Jost et al. 2015; Singh et al. 2018). However, unlike the previous studies that focused on cue processing before target occurrences (Jost et al. 2015; Singh et al. 2018; Boettcher et al. 2020), our study demonstrated that cue processing after outcomes is influenced by the preceding target TP during statistical learning. Specifically, our results suggest that input uncertainty alters cue-processing mechanisms during statistical learning, with higher-predictive cues exhibiting weaker representation than lower-predictive ones after high-TP but not medium-TP or low-TP targets, which indicates the occurrence of an exploration-like cue-processing mechanism after low-uncertatinty but not higher-uncertainty inputs.
Nevertheless, it should be noted that such cue predictiveness effect might be confounded to some extent by the lower informativeness of medium-predictive cues (i.e., randomly predicting two targets) compared with high-predictive and low-predictive cues (i.e., preferentially predicting one target over the other). To eliminate this confounding factor, experiment 2 used three equally informative cues to further investigate how uncertainty alters the effect of cue predictiveness on cue representation during visual statistical learning.
Experiment 2
Experiment 2 replaced the noninformative, medium-predictive cue with an informative but zero-predictive cue, as shown in Figure 2A, and examined how the representation of cues was interactively influenced by the preceding target TP (i.e., high = 75% and low = 25%) and cue predictiveness (i.e., high = 75%, low = 25%, and zero).
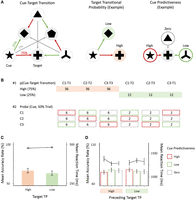
Schematic of experiment 2. (A) Target transitional probability (TP; i.e., high [75%]) and low [25%]) was decided by the conditional probability of each target following a cue. In terms of individual targets, the predictiveness of cues (i.e., high [75%], low [25%], and zero [0%]) was determined by the levels of probability in which each cue predicted that target. (B) The distribution of trial numbers in different preceding target TP ([red shading] high, [green shading] low) and cue predictiveness ([red border] high, [green border] low, [gray border] zero) conditions for each block. (C) Mean accuracy rates (bar chart) and mean reaction times (line chart) for detecting high-TP and low-TP targets in the target detection task. Error bars indicate standard errors. (D) Mean accuracy rates (bar chart) and mean reaction times (line chart) for identifying high-predictive, low-predictive, and zero-predictive cue probes after high-TP and low-TP targets in the probe identification task. Error bars indicate standard errors.
Target detection
Figure 2C shows mean accuracy rates and RTs for detecting high-TP and low-TP targets in the target detection task (the exact descriptive statistics are also in the Supplemental Material). As summarized in Table 3, the mixed-effect logistic regression model for target detection accuracy [AIC = 17,056, R2 = 0.19, χ²(3) = 216.89, P < 0.001] and the mixed-effect linear regression model for RT [AIC = 101,400, R2 = 0.19, χ²(3) = 177.61, P < 0.001] significantly outperformed the null model (AICaccuracy = 17,267, AICRT = 101,571). A significant interaction between the target TP and blocks is shown for both accuracy (β = 0.19, 95% CI [0.02, 0.35], P = 0.030) and RTs (β = −8.01, 95% CI [−12.23, −3.79], P < 0.001). The estimated marginal effects revealed that the increase in target TP improved the odds of accurately detecting the target and reduced the RT of target detection in the second (Ps = 0.001) and third (Ps < 0.001) blocks but not in the first block. These results suggest that participants acquired the association between cues and targets in the last two blocks.
Mixed-effect regression models for target detection accuracy and reaction time in experiment 2 with target TP and blocks as predictors
Probe identification
Figure 2D displays mean accuracy rates and RTs for identifying high-predictive, low-predictive, and zero-predictive cue probes after varying levels of TP targets in the probe identification task (the exact descriptive statistics are also in the Supplemental Material). Table 4 summarizes the results of the mixed-effect logistic regression model for probe identification accuracy [AIC = 5905, R2 = 0.42, χ²(7) = 36.44, P < 0.001] and the mixed-effect linear regression model for RT [AIC = 97,162, R2 = 0.08, χ²(7) = 145.07, P < 0.001], both of which outperformed the null model (AICaccuracy = 5927, AICRT = 97,293). A significant main effect of blocks was found for the probe identification RTs (β = −155.89, 95% CI [−290.57, −21.21], P = 0.023), showing an increasing speed of identifying cue probes across blocks. Also, a significant interaction effect was found between preceding target TP and cue predictiveness for both accuracy (β = −1.20, 95% CI [−2.16, −0.24], P = 0.015) and RT (β = 387.82, 95% CI [24.98, 750.67], P = 0.036). The estimated marginal effects revealed that the increase of cue predictiveness significantly reduced the odds of accurately identifying probes (P = 0.020) but increased the RT (P < 0.001) of probe identification when the target TP was high. However, no such pattern was found for accuracy (P = 0.137) or RT (P = 0.703) when the target TP was low. These results suggest that exploration-like cue processing might be triggered by high-TP but not low-TP targets.
Mixed-effect regression models for probe identification accuracy and reaction time in experiment 2 with preceding target TP, cue predictiveness, and blocks as predictors
Summary
In experiment 2, the informativeness of high-predictive, low-predictive, and zero-predictive cues was balanced, and the results showed that participants displayed higher accuracy and speed in detecting high-TP targets compared with low-TP targets. Moreover, when compared with cues with lower predictive values, cues with higher predictive values exhibited weaker representation after high-TP targets but not low-TP targets. These findings indicate that processing low-uncertainty inputs rather than high-uncertainty inputs triggered exploration-like cue processing.
However, it was noted1 that in the high-TP target condition, the high-predictive cue probes matched the cues that appeared before the targets. As previous research has shown the repetition of stimuli can elicit additional effects such as negative priming (Tipper 1985) or inhibition of return (Dukewich 2009), this raises the possibility that the suppressed representation of high-predictive cues after high-TP targets could be due to the repeated appearance of cue shapes. To eliminate this alternative explanation, experiment 3 analyzed the trials that contained probes that were mismatched with preceding cues and added a target recognition task after the learning phase to examine learners’ awareness of cue–target associations.
Experiment 3
Experiment 3 eliminated the probe repetition by assigning two high-predictive, low-predictive, and zero-predictive cues for each specific target, as shown in Figure 3A. Thus, after a subset of high-TP cue–target sequences (e.g., C1a-T1), the cue probes (e.g., C1b) with the shapes different from the preceding cues (C1a) were used to examine the representation of high-predictive cues and eliminate the negative priming effect. Additionally, a target recognition task after the learning phase was added to assess learners’ awareness of cue–target associations in order to examine whether exploration-like and exploitation-like cue-processing mechanisms depend on explicit awareness of regularities.
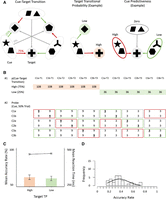
Schematic of experiment 3. (A) Target transitional probability (TP; i.e., high [75%] and low [25%]) was decided by the conditional probability of each target following a cue. In terms of individual targets, the predictiveness of cues (i.e., high [75%], low [25%], and zero [0%]) was determined by the levels of probability in which each cue predicted that target. (B) The distribution of trial numbers in different preceding target TP ([red shading] high, [green shading] low) and cue predictiveness ([red border] high, [green border] low, [gray border] zero) conditions. Probes matched with the preceding cues are bold and underlined. (C) Mean accuracy rates (bar chart) and mean reaction times (line chart) for detecting high-TP and low-TP targets in the target detection task. Error bars indicate standard errors. (D) Histogram of mean accuracy rate for target recognition using a 0.05 (accuracy rate) bin width. The area of each block represents the frequency of participants (total number = 30) within that bin.
Target detection
Figure 3C shows mean accuracy rates and RTs for detecting high-TP and low-TP targets in the target detection task (the exact descriptive statistics are in the Supplemental Material). As summarized in Table 5, the mixed-effect logistic regression model for target detection accuracy [AIC = 30,899, R2 = 0.20, χ²(3) = 493.97, P < 0.001] and the mixed-effect linear regression model for RT [AIC = 173,075, R2 = 0.14, χ²(3) = 91.69, P < 0.001] significantly outperformed the null model (AICaccuracy = 31,387, AICRT = 173,160). The main effect of the target TP was significant for both accuracy (β = 0.17, 95% CI [0.04, 0.29], P = 0.009) and RTs (β = −11.54, 95% CI [−15.90, −7.17], P < 0.001), indicating that the increase in target TP improved the odds of accurately detecting the target and reduced the RT of target detection. Additionally, the main effect of blocks was significant for accuracy (β = 0.29, 95% CI [0.20, 0.37], P < 0.001), showing improved odds of accurately detecting the targets as the block increased. These results suggest successful statistical learning of cue–target associations.
Mixed-effect regression models for target detection accuracy and reaction time in experiment 3 with target TP and blocks as predictors
Target recognition
The mean recognition accuracy rate (M = 0.37, SD = 0.15) was averaged across all trials given the comparable accuracy rates of recognizing most likely (M = 0.38, SD = 0.22) and most unlikely (M = 0.36, SD = 0.15) targets (t(29) = 0.59, P = 0.557). The group-level mean accuracy rate was not significantly different from the chance level (0.33; t(29) = 1.52, P = 0.140).
Figure 3D shows the histogram of the distribution of mean target recognition accuracy rate, with half of them (N = 15) above the chance level, while the other half (N = 15) did not exceed the chance level (the exact frequencies of mean target recognition accuracy rate are also in the Supplemental Material). The coefficient of skewness (M = 0.97, SD = 0.43) suggested a significant negative-skewed distribution (zskewness = 0.97/0.43 = 2.26 > 1.96), so that individual awareness was submitted as a categorical variable (i.e., above or not above the chance level) instead of as a continuous variable into the regression models of cue probe identification.
Probe identification
To eliminate any potential confounding effect of probe repetition, the analysis for probe identification performance focused exclusively on the trials in which probes were mismatched with the preceding cues while excluding the trials with matched cues and probes.
Figure 4, A and B, depicts the change of probe identification accuracy rates and RTs across blocks in different preceding target TP and cue predictiveness conditions for learners with and without above-chance awareness of cue–target associations. Table 6 summarizes the results of the regression analysis. The mixed-effect logistic regression model (AIC = 11,088) for probe identification accuracy outperformed the null model [AIC = 11,089, R2 = 0.33, χ²(15) = 31.02, P = 0.009] and revealed a significant four-way interaction effect among preceding target TPs, cue predictiveness, blocks, and awareness (above chance vs. not above chance; β = −1.42, 95% CI [−2.75, −0.08], P = 0.038). Estimated marginal effects revealed that for learners who showed above-chance awareness, the increase of blocks improved the odds of accurately identifying low-predictive cue (P = 0.003), and zero-predictive cue (P < 0.001) probes when the preceding target TP was high but improved the odds of accurately identifying high-predictive cue probes (P = 0.040) when the preceding target TP was low. Only the pattern triggered by high-TP, not low-TP, targets was observed in learners who did not attain above-chance-level awareness. Specifically, after high-TP targets, the odds of accurately identifying low-predictive cue (P = 0.018) and zero-predictive cue (P = 0.032), but not high-predictive cue (P = 0.531), probes increased across blocks, while after low-TP targets, the block effect was not significant for high-predictive cues (P = 0.647), low-predictive cues (P = 0.265), or zero-predictive cues (P = 0.334).
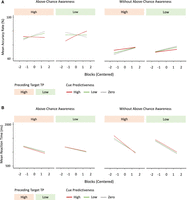
Results of probe identification in experiment 3. (A) Model prediction of identification accuracy (Y-axis) based on the predictors of blocks (X-axis). The line color represents various predictive cue probes that are preceded by targets with high and low transitional probability (TP). The data are presented for learners with and without above-chance awareness of cue–target association. (B) Model prediction of identification reaction time (Y-axis) based on the predictors of blocks (X-axis). The line color represents various predictive cue probes that are preceded by targets with high and low transitional probability (TP). The data are presented for learners with and without above-chance awareness of cue–target associations.
Mixed-effect regression models for probe (mismatched) identification accuracy and reaction time in experiment 3 with preceding target TP, cue predictiveness, blocks, and awareness (not above chance as reference) as predictors
The mixed-effect linear regression model (AIC = 120,637) on mismatched probe identification RT [R2 = 0.16, χ²(15) = 225.15, P < 0.001], summarized in Table 6, significantly outperformed the null model (AIC = 120,833). The main effect of blocks was significant (β = −104.43, 95% CI [−176.77, −32.10], P = 0.005), indicating faster probe identification RT as blocks increased.
Discussion
Developing a probabilistic cueing validation paradigm to systematically manipulate the uncertainty of inputs (i.e., targets) and cue predictiveness, this study investigated cue representation after the occurrence of high-TP (75%), medium-TP (50%), and low-TP (25%) targets during visual statistical learning. Results demonstrated that the activation of cue-processing mechanisms was altered by input uncertainty. After high-TP targets, the association between cue predictiveness and cue representation was found to be significantly negative. Moreover, after high-TP targets, the representation of lower-predictive but not high-predictive cues enhanced across blocks regardless of learners’ awareness. In contrast, after low-TP targets, the representation of high-predictive instead of lower-predictive cues increased across blocks among learners who exhibited awareness of cue–target associations. These findings suggest that lower-uncertainty inputs triggered an exploration-like cue processing, while higher-uncertainty inputs triggered an exploitation-like cue processing.
The finding that low-uncertainty inputs triggered the exploration-like cue-processing mechanism suggests that humans can adapt to learned associations (e.g., high-predictive cues) but prefer unlearned information (e.g., lower-predictive cues) when the inputs (e.g., high-TP targets) confirm the overarching patterns. Our result is consistent with a prior statistical learning study showing impaired memory encoding of 100% predictive cues compared with nonpredictive cues (Sherman and Turk-Browne 2020). However, our result also extends this notion by indicating that adaptive processes of learned associations can occur outside a cue–target prediction context and are contingent on the reliability of the established representations.
It is important to note that the adaptive processing of environmental patterns found in previous studies is manifested as attenuated neural activations on high-probability (e.g., repeated or expected) inputs (i.e., neural adaptation) (Todorovic and De Lange 2012; Feuerriegel et al. 2021), reflecting the impact of previous experience on the function of the brain cortex (Gilbert et al. 2009; Reber 2013). Our results align with previous research by emphasizing the role of high-probability inputs in activating adaptive processes. Nevertheless, unlike these prior studies, our findings clarify that attenuated representation occurred for high-probability-associated information (i.e., higher-predictive cues) but not high-TP inputs (i.e., targets). Future studies could extend these findings by investigating the neural correlates of different predictive cues when inputs confirm the associative regularities.
However, unlike high-TP targets, low-TP targets may induce exploitation-like cue processing, as evidenced by the enhanced representation of high-predictive rather than lower-predictive cues after low-TP targets across blocks among learners who were aware of cue–target associations (see experiment 3). This result implies that when inputs contain higher uncertainty, in order to explain or overcome the discrepancy between actual observations and prior experiences, learners may consciously retrieve high-predictive cues, which are supposed to predict the perceiving inputs (Pinquart et al. 2021). Our explanation is supported by a previous study showing that an enhanced verbalization of sequence rules was observed when unexpected sequences were inserted (Rünger and Frensch 2008). Together, these results suggest that higher uncertainty or unexpectedness during implicit learning may elicit conscious retrieval of learned regularities.
Furthermore, we observed a change in cue representation across blocks in experiment 3 but not in experiments 1 and 2. One possible explanation is that the relatively complex cue–target transitions in experiment 3 prolonged the time courses for forming sophisticated cue–target associative patterns (i.e., six cues × three targets). Thus, as learning progressed, exploration-like cue processing gradually emerged after high-TP targets, which manifested as an enhanced cue representation of lower-predictive cues across blocks. In contrast, exploitation-like cue processing gradually formed and functioned after low-TP targets, which was evidenced by an enhanced cue representation of high-predictive cues across blocks. Our interpretation of cue-processing mechanisms and block effects aligns with a previous study on associative learning involving eight cues and two targets. The findings revealed that the decrease in overt attention, as measured by proportional dwell time, was evident across blocks for low-consistency compounds (70% appearing before an outcome) but not for high-consistency cue compounds (100% appearing before an outcome). This suggests that participants engaged in cue exploration during the process of associative learning (Beesley et al. 2015).
Additionally, exploration-like cue processing and exploitation-like cue processing, triggered by high-TP and low-TP targets, respectively, related differently to the eventual awareness of cue–target associations in experiment 3. This can be explained in terms of the relation between the strength of learning and the utilization of exploration-like and exploitation-like cue processing. Specifically, the participants with above-chance awareness of cue–target association exhibited stronger learning abilities, allowing them to flexibly switch between exploration and exploitation strategies based on outcome reliability (Domenech et al. 2020). Moreover, the strength of learning may affect the emergency of exploitation-like cue processing after high-TP targets. In initial blocks under high-TP preceding target conditions, both participants with and without above-chance awareness showed lower probe identification accuracy for high-predictive cues compared with low-predictive and zero-predictive cues (see Fig. 4A). However, the accuracy improvement for low-predictive and zero-predictive cues was slower for participants without above-chance awareness (low: block trend = 0.09; zero: block trend = 0.10) compared with participants with above-chance awareness (low: block trend = 0.12; zero: block trend = 0.19). These findings suggest that the transition from implicit learning to conscious awareness may be related to the speed of adapting to familiar information. This aligns, in part, with a recent eye-tracking study on visual statistical learning that found that individuals with greater statistical learning ability directed attention to more complex sequences earlier in the learning process (Forest et al. 2022).
Furthermore, the awareness of cue–target associations affects exploitation-like cue processing more than exploration-like cue processing. Learners showed exploration-like cue processing after high-TP targets, as indicated by their increased identification accuracy for lower-predictive but not high-predictive cue probes, regardless of their level of awareness. In contrast, exploitation-like cue processing after low-TP targets, indicated by the increased identification accuracy for high-predictive but not lower-predictive cue probes, was only observed among learners with above-chance awareness. Our primary explanation for these findings is that processing mechanisms triggered by high-TP and low-TP targets are different. When learners encountered inputs that confirm the overarching pattern, a relatively implicit system that relies less on conscious awareness may dominate subsequent information processing. Conversely, when inputs violate regularities and induce uncertainty during visual statistical learning, a more explicit system that requires conscious awareness becomes more involved. These findings critically and empirically support the implicit–explicit dual-mechanism view of statistical learning (Conway 2020) and clarify that input uncertainty regulates the involvement of implicit and explicit systems.
While increasing evidence suggests that predictive or associative history influences attention allocation and stimulus associability (Beesley and Le Pelley 2010; Le Pelley et al. 2011; Beesley et al. 2015; Griffiths et al. 2015), our study is the first to examine cue processing after the target offset, thereby clarifying how information is processed after encountering new inputs rather than at the moment of anticipating subsequent inputs. This is critical, since human learning is not solely about making predictions and observing outcomes but also entails updating knowledge representations based on the discrepancies between new observations and prior expectations/beliefs (Bennett et al. 2015). The exploration-like cue processing and exploitation-like cue processing posterior to high-TP and low-TP targets, respectively, indicate how learners represent associative information when new observations confirm or violate associative rules.
Taken together, the posttarget cue-processing patterns align well with predictive coding frameworks in perceptual learning, suggesting that humans tend to conserve “free energy” by expending less effort on incoming information that fails to provide significant content beyond what they already know (Friston 2009). This principle informs our findings by showing that participants conserved cognitive resources when encountering high-predictive cues after the appearance of high-TP targets, since high-TP cue–target sequences were highly anticipated, making the high-predictive cues less informative. In contrast, when low-TP targets occurred, participants expended resources to handle the discrepancy between prior beliefs and actual observations, which produces uncertainty. One possible solution for overcoming the interferences of this uncertainty is to consciously retrieve learned regularities (Rünger and Frensch 2008; Haider and Frensch 2009). Thus, enhanced representation of high-probability-associated cues was observed only among the participants who exhibited above-chance-level awareness of cue–target association as the learning process progressed.
Additionally, exploration-like and exploitation-like cue processing triggered by high-TP and low-TP targets, respectively, partially align with and may extend the theories of conditional and instrumental learning. The sometimes opponent processes (SOP) model suggests that during conditional learning, each conditional and unconditional stimulus possesses three activation states; namely, inactivity, primary activity, and refractory activity (Vogel et al. 2019). The presence of a stimulus first triggers its activation state from inactivity to primary activity. However, this primary activation gradually declines to a state of refractory activity before eventually returning full circle to its state of inactivity. If the activity of one stimulus remains in a refractory state, the transition into primary activity is hindered. Based on this principle, our finding (i.e., the suppressed representation of higher-predictive cues after high-TP targets) can be explained by the occupation of the refractory activity state triggered by the preceding cues, which is similar to the negative priming account when applied to the high-TP target condition.
Nevertheless, extending the suppression generated by the identical preceding stimuli, experiment 3 used the cue probes that mismatched with preceding cues and showed an enhanced representation of lower-predictive rather than high-predictive cues across blocks after high-TP targets. These results suggest that exploration-like cue processing cannot be attributed simply to the occupation of refractory activity by the same stimuli. Instead, exploration-like cue processing is triggered by the high-probability associations between high-predictive cue objects and the preceding targets. According to the SOP theory, the occurrence of conditional and unconditional stimuli generates associative linkages between them, whereby the primary activity of the conditional stimulus triggers the refractory activity of the unconditional stimulus. Experiment 3 extended this principle in a reverse direction by demonstrating the emergence of exploration-like cue processing after high-TP targets. Specifically, as learning progresses, the primary activity of unconditional stimuli (i.e., targets) may elicit the refractory activity of conditional stimuli, especially for higher-probability-associated cues, resulting in greater prevention of the primary activity of high-predictive cue objects compared with low-predictive or zero-predictive cue objects.
Unlike conditional learning, which emphasizes the co-occurrence of environmental stimuli in human regularity acquisition, instrumental learning asserts that humans can actively deduce the causal relationships between their actions and resulting outcomes. This goal-directed behavior typically requires an understanding of the relationships between causes and outcomes (belief criteria), as well as a need to evaluate or process outcomes (i.e., desire criteria) (de Wit and Dickinson 2009). Our finding that enhanced representation of high-predictive cues occurred only among participants who exhibited above-chance awareness of cue–target associations after low-TP targets can also be explained by the belief criteria of goal-directed behavior. Specifically, during the later stage of statistical learning, participants who were aware of cue–target associations may have actively anticipated (i.e., action) the incoming targets according to the preceding visual cues and evaluated cue–target relationships after perceiving high-TP or low-TP targets (i.e., outcomes). As previous studies have demonstrated that the activation of outcomes can prime the actions (Elsner and Hommel 2004), the occurrence of low-TP targets may activate the representation of the most probable cause (i.e., the high-predictive cue) for participants who have established cue–target associations.
In sum, the patterns of certainty-triggered, awareness-independent exploration-like cue processing and uncertainty-triggered, awareness-dependent exploitation-like cue processing are in alignment with the principles of automatic conditional learning and goal-directed instrumental learning, respectively. These principles extend associative learning to human implicit learning, reinforcing the mutimechanism view of statistical learning. Specifically, after high-TP targets, suppressed representation occurred for cues with higher predictiveness rather than lower predictiveness. Such exploration-like cue processing emerged as learning progressed regardless of participants’ awareness of cue–target associations. However, after low-TP targets, exploitation-like cue processing, as indexed by the enhanced representation of high-predictive instead of lower-predictive cue probes across blocks, was observed only among learners who exhibited above-chance awareness of cue–target associations. These findings suggest that input uncertainty alters cue-processing mechanisms during visual statistical learning, with relatively implicit exploration-like and relatively explicit exploitation-like cue processing triggered by lower-uncertainty and higher-uncertainty inputs, respectively.
Materials and Methods
Experiment 1
Participants
Thirty-five native Mandarin-speaking Chinese undergraduates and university staff (Mage = 26.14 yr, SDage = 5.23 yr) participated in this study. With this sample size, we were able to achieve a 0.50 effect size at a significant level of 0.05 and a statistical power of 0.80 (Faul et al. 2009). Written informed consent was obtained from all participants, and research protocols were approved by our university's Human Research Ethics Committee. Participants were compensated $50 HKD (≈$6.44 USD).
Apparatus
All participants were individually tested in a sound-attended booth using a Dell laptop (14-in Dell Latitude 5490; resolution, 1920 × 1080 pixels; refresh rate, 60 Hz; screen width, 30.5 cm). Participants were seated ∼35 cm from the monitor. The experiment was programmed and presented using Python 3.8.1 (Van Rossum and Drake 2009).
Stimuli
Five black geometric shapes (i.e.,  ,
,  ,
,  ,
,  , and
, and  ) were used in a probabilistic cueing validation paradigm in which the occurrence of a target was predicted by a visual cue
with a certain probability. A probe identical to one of the predictive cues was then rapidly presented after half of the targets
to assess the representation of different predictive cues. Each shape was presented at a 6.5° × 6.5° visual angle. Three of
these shapes (i.e.,
) were used in a probabilistic cueing validation paradigm in which the occurrence of a target was predicted by a visual cue
with a certain probability. A probe identical to one of the predictive cues was then rapidly presented after half of the targets
to assess the representation of different predictive cues. Each shape was presented at a 6.5° × 6.5° visual angle. Three of
these shapes (i.e.,  ,
,  , and
, and  ) were used in previous visual statistical learning studies (Kirkham et al. 2002; Addyman and Mareschal 2013), while the other two (i.e.,
  and
and  ) were used by Huang (2020). For each participant, two of the five shapes were randomly assigned as targets, while the other three served as cues. The
assignment of these five shapes as targets or cues was counterbalanced between participants to eliminate extraneous preference
for a specific shape. For each participant, the assignment remained constant across trials. Additionally, based on previous
studies (Jost et al. 2015; Singh et al. 2018), the shape “
) were used by Huang (2020). For each participant, two of the five shapes were randomly assigned as targets, while the other three served as cues. The
assignment of these five shapes as targets or cues was counterbalanced between participants to eliminate extraneous preference
for a specific shape. For each participant, the assignment remained constant across trials. Additionally, based on previous
studies (Jost et al. 2015; Singh et al. 2018), the shape “ ” with a visual angle of 6.5° × 6.5° was designated as a filler stimulus to precede cue–target sequences and prevent the participant
from habitually responding to every other stimulus.
” with a visual angle of 6.5° × 6.5° was designated as a filler stimulus to precede cue–target sequences and prevent the participant
from habitually responding to every other stimulus.
As illustrated in Figure 1A, these targets and cues formed three cue–target transitions in which different visual cues predicted the occurrence of different
targets with high (75%), medium (50%), and low (25%) transitional probabilities (TPs). Two of the three cues predicted the
occurrence of one target 75% of the time and the other target 25% of the time. The third cue predicted each of the two targets
50% of the time. For example, the occurrence of the visual cue “ ” predicted the subsequent occurrence of the target “
 ” 75% of the time, making “
 ” a high-TP target. In contrast, the same visual cue “
 ” predicted the subsequent occurrence of the target “
 ” 25% of the time, making “
 ” a low-TP target. In the third condition, the visual cue “
 ” predicted each of the targets “
 ” and “
 ” 50% of the time, making them medium-TP targets.
Furthermore, three types of cues were categorized (i.e., high-predictive [75%], medium-predictive [50%], and low-predictive
[25%]) based on their conditional probability to predict individual targets (see Fig. 1A). For example, the cues “ ,” “
,” “ ,” and “
 ” predicted the target “
 ” 75%, 50%, and 25% of the time, respectively, meaning that “
 ” was a high-predictive cue, “
 ” was a medium-predictive cue, and “
 ” was a low-predictive cue. Critically, three probes, identical in shape to the cues, appeared after half of the targets to
assess the representations of the cues. For example, after target “
” was a low-predictive cue. Critically, three probes, identical in shape to the cues, appeared after half of the targets to
assess the representations of the cues. For example, after target “ ,” the representations of the high-predictive “
 ,” medium-predictive “
 ,” and low-predictive “
 ” cues were assessed by the probes “
 ,” “
,” “ ,” and “
 ,” respectively.
Procedure
As depicted in Figure 1B, during the experiment, participants were asked to perform two tasks: a target detection task, in which they were asked to identify two targets by pressing the corresponding “X” or “M” key, and a probe identification task, in which they were expected to indicate the shape of a cue probe that was presented rapidly by pressing the corresponding “1,” “2,” or “3” key. Response accuracy and reaction time of both tasks were recorded. Across the tasks, participants were not informed of any predictive relations between the visual cues and targets or the assignment and purpose of the probes. Prior to real testing, participants were familiarized with the experimental procedure by completing 30 practice trials comprising 24 target detection and six probe identification trials. The stimuli used during the practice task were identical to those in the test trials but had no predictive relations between cues and targets to minimize any learning effects. The testing trial did not start until participants reached a target accuracy of 80%.
Each participant completed 432 trials, half of which were cue–target trials where one to three fillers were presented, followed by one visual cue and one target. One to three fillers were randomly assigned before the appearance of cues to prevent a habituated (i.e., every other stimulus) key response pattern (Jost et al. 2015; Singh et al. 2018). The other half were cue–target–probe trials in which a visual probe was rapidly presented after the appearance of a target.
For cue–target trials, fillers, visual cues, and targets were displayed in the center of the screen on a white background for 500 msec, followed by a 250-msec blank screen. For the cue–target–probe trials, a probe was displayed for 34 msec in the center of the screen 116 msec after the target disappeared. A mask with a 9.5° × 9.5° visual angle was displayed for 100 msec after the probe. Following the appearance of a probe and a mask, three potential probe shapes appeared on the screen with corresponding numbers “1,” “2,” and “3.” The positions of the three shapes were randomized across trials. Each shape had a visual angle of 2.6° × 2.6°, while each corresponding number had a visual angle of 1.3° × 0.8°. The distance between two contiguous shapes and two contiguous numbers was 9.8° of the visual angle.
All trials were assigned to three blocks, with each block consisting of 144 trials for equal distribution of each visual cue, generating 72 high-TP, 48 medium-TP, and 24 low-TP targets (see Fig. 1C). Half of the trials for each type of target (i.e., 36 high-TP, 24 medium-TP, and 12 low-TP targets) were followed by three types of equally distributed probes (i.e., one-third for high-predictive, one-third for medium-predictive, and one-third for low-predictive cues). Thus, in one block, the representation of each type of predictive cue was examined 12 times after high-TP targets, eight times after medium-TP targets, and four times after low-TP targets, as illustrated in Figure 2C. The entire experiment lasted ∼45 min with a 2-min break between blocks.
Data analysis
Data were analyzed using the lme4 package in R. The simple effect was estimated using the emmeans package in R. All materials, data, and analysis codes are available through Open Science Framework (https://osf.io/gzmvr/files). Four participants’ data were excluded from our analyses because of technological error (one participant) and outlier performances (i.e., 2.5 SD below the group mean) in target detection (one participant) and probe identification (two participants). Thus, data analyses were conducted based on 31 participants (Mage = 25.77 yr, SDage = 4.51 yr).
To examine the statistical learning effect (i.e., whether target TP influenced target detection performance), a mixed-effect logistic regression analysis was performed on each trial's target detection accuracy. In addition, a mixed-effect linear regression analysis was performed on each trial's target detection reaction time (RT). Both models included target TP (numerical coding), blocks (centered and scaled), and their interaction as fixed effects as well as the intercept of participants and stimuli as random effects. Trials with incorrect target responses were excluded from the RT analysis.
To investigate the cue-processing mechanisms when inputs appeared with various levels of uncertainty, we examined the impact of preceding target TP and cue predictiveness on cue representation. A mixed-effect logistic regression analysis was performed on each trial's probe identification accuracy. Also, a mixed-effect linear regression analysis was performed on each trial's probe identification RT. The fixed effects in both models were preceding target TP (numerical coding), cue predictiveness (numerical coding), blocks (centered and scaled), and their interaction effect. The random effects were the intercept of participants and stimuli justified by data convergence. The trials with incorrect probe responses were excluded from the RT analysis.
Experiment 2
Participants
Thirty-six native Mandarin-speaking Chinese undergraduates and university staff (Mage = 26.39 yr, SD = 5.42 yr) who were not involved in experiment 1 participated in this study. This sample size enabled us to achieve a 0.50 effect size at a significant level of 0.05 and a statistical power of 0.80 (Faul et al. 2009). Written informed consent was obtained from all participants, and they were compensated $50 HKD (≈$6.44 USD).
Apparatus
The apparatus in experiment 2 was the same as in experiment 1.
Stimuli
Stimuli comprised four of the same black geometric shapes (i.e.,  ,
,  ,
,  , and
, and  ) used in experiment 1 plus two new shapes (i.e.,
  and
and  ). As in experiment 1, three of these shapes (i.e.,
  ,
,  , and
, and  ) were randomly assigned to be targets while the other three (i.e.,
  ,
,  , and
, and  ) served as visual cues. The assignment of these six shapes as targets and visual cues was counterbalanced between participants
to eliminate extraneous preference for a specific shape. For each participant, the assignment remained constant across trials.
) served as visual cues. The assignment of these six shapes as targets and visual cues was counterbalanced between participants
to eliminate extraneous preference for a specific shape. For each participant, the assignment remained constant across trials.
These targets and cues formed three cue–target transitions in which different visual cues predicted the appearance of three
targets with high (75%), low (25%), and zero transitional probabilities (see Fig. 2A). For example, the occurrence of the visual cue “ ” predicted the subsequent occurrence of the target “
 ” 75% of the time, making “
 ” a high-TP target. In contrast, the same visual cue predicted the subsequent occurrence of the target “
 ” 25% of the time, making “
 ” a low-TP target.
Furthermore, three types of cues were categorized (i.e., high [75%], low [25%], and zero) based on their conditional probability
to predict individual targets (see Fig. 2A). For example, the cues “ ,” “
,” “ ,” and “
 ” predicted the target “
 ” 75%, 25%, and 0% of the time, respectively, meaning that “
 ” was a high-predictive cue, “
 ” was a low-predictive cue, and “
 ” was a zero-predictive cue. As in experiment 1, the representations of these cues were examined by the probes appearing after
half of the targets. For example, after target “
” was a zero-predictive cue. As in experiment 1, the representations of these cues were examined by the probes appearing after
half of the targets. For example, after target “ ,” the representations of the high-predictive cue “
 ,” low-predictive cue “
 ,” and zero-predictive cue “
 ” were assessed by the probes “
 ,” “
,” “ ,” and “
 ,” respectively.
Procedure
The procedure was the same as in experiment 1 except for the following changes. First, for the target detection task, participants were asked to identify three targets by pressing the keys “G,” “H,” or “J,” so that the duration of black geometric shapes, fillers, visual cues, and targets was extended to 550 msec. Second, participants were provided with 72 practice trials to familiarize themselves with the experimental procedure.
As shown in Figure 2B, the 432 trials were assigned to three blocks, with each block consisting of 144 trials of equal distribution for each visual cue, generating 108 high-TP targets and 36 low-TP targets. Half of the trials for each type of target (i.e., 54 high-TP targets and 18 low-TP targets) were followed by three types of equally distributed probes (i.e., one-third for high-predictive, one-third for low-predictive, and one-third for zero-predictive cues). Thus, in one block, each type of probe appeared 18 times after high-TP targets and six times after low-TP targets.
Data analysis
The data analysis in experiment 2 was identical to experiment 1. All materials, data, and analysis codes are available through Open Science Framework (https://osf.io/gzmvr/files). Two participants’ data were excluded from our final analysis because of outlier performance (i.e., 2.5 SD below the group mean) in the probe identification task. Thus, the following analyses were conducted based on 34 participants (Mage = 25 yr, SDage = 5.42 yr).
Experiment 3
Participants
Thirty Chinese undergraduates and university staff (Mage = 23.30 yr, SDage = 3.65 yr) who were not involved in experiment 1 or 2 participated in this study. This sample size allowed us to achieve a 0.50 effect size at a significant level of 0.05 and a statistical power of 0.80 (Faul et al. 2009). Written informed consent was obtained from all participants, and they were compensated $50 HKD (≈$6.44 USD).
Apparatus
The apparatus in experiment 3 was identical to experiment 1.
Stimuli
Stimuli comprised six black geometric shapes (i.e.,  ,
,  ,
,  ,
,  ,
,  , and
, and  ) previously used in experiment 1, as well as three new shapes (i.e.,
  ,
,  , and
, and  ). As in experiment 2, three of these shapes (e.g.,
  ,
,  , and
, and  ) were randomly assigned to be targets while the other six (e.g.,
  ,
,  ,
,  ,
,  ,
,  , and
, and  ) served as visual cues. The assignment of these nine shapes as targets and visual cues was counterbalanced between participants
to eliminate extraneous preference for a specific shape. For each participant, the assignment remained constant across trials.
As in experiment 2, the cue–target transitions generated two types of targets (high-TP targets [75%] and low-TP targets [25%]),
and the cues were classified as high-predictive (75%), low-predictive (25%), and zero-predictive based on the likelihood of
predicting individual targets, as shown in Figure 3A.
) served as visual cues. The assignment of these nine shapes as targets and visual cues was counterbalanced between participants
to eliminate extraneous preference for a specific shape. For each participant, the assignment remained constant across trials.
As in experiment 2, the cue–target transitions generated two types of targets (high-TP targets [75%] and low-TP targets [25%]),
and the cues were classified as high-predictive (75%), low-predictive (25%), and zero-predictive based on the likelihood of
predicting individual targets, as shown in Figure 3A.
Procedure
The procedure in experiment 3 was the same as in experiment 2 except for the following changes. First, the options (i.e., one correct answer and two selected distractors) in the probe identification task were selected from six possible cues but carried different predictiveness. Second, a target recognition task appeared after the visual statistical learning experiment to assess individuals’ eventual awareness of cue–target associations. Participants were not informed about the target recognition task and any relations between visual shapes before the experiment.
During the learning phase, 864 trials were assigned to six blocks of equal distribution for each visual cue, generating 648 high-TP targets and 216 low-TP targets. Half of the trials for each type of target (i.e., 324 high-TP targets and 108 low-TP targets) were followed by three types of equally distributed probes (i.e., one-third for high-predictive, one-third for low-predictive, and one-third for zero-predictive cues). Moreover, as shown in Figure 3B, in two specific conditions (i.e., high-predictive cue probes following high-TP targets and low-predictive cue probes following low-TP targets), half of the probes were matched with the preceding cues, while the other half were mismatched. These mismatched cue probes were designed to eliminate probe repetition issues, which was the core improvement of experiment 3 compared with experiment 2.
During the testing phase, one examined cue and three optional targets appeared on the screen. Participants were asked to select which target was most likely or most unlikely to appear afterward given the examined cue by pressing the “1,” “2,” or “3” corresponding key, based on their experience during previous learning blocks. Thirty-six trials were assigned to six examined cues, with six trials for each cue. Half of these were “most likely” questions while the other half were “most unlikely” questions, and the order of questions was counterbalanced between participants. The corresponding keys of optional shapes were randomized across different trials.
Data analysis
All materials, data, and analysis codes are available through Open Science Framework (https://osf.io/gzmvr/files). The data analysis for target detection performance was identical to experiment 2. No data were excluded from our analyses.
In contrast to experiments 1 and 2, to evaluate the cue-processing mechanisms after various uncertainty inputs without the confounding of probe repetition, we performed a mixed-effect logistic regression analysis on the probe identification accuracy as well as a mixed-effect linear regression analysis on probe identification RT for the trials that contained mismatched cue probes. Fixed effects included preceding target TP (numerical coding), cue predictiveness (numerical coding), blocks (centered and scaled), and awareness (simple coding, reference = not above chance). Given the negative-skewed distribution (see the experiment 3 results), individuals’ awareness of cue–target associations was submitted as a categorical rather than continuous variable (above chance or not above chance). The intercept of participants and stimuli was added as a random effect. The trials with incorrect probe responses were excluded from the RT analysis.
Acknowledgments
This work was supported by funding from the Research Fellow Scheme (RFS 2021-7H05) of the Hong Kong Government Research Grant Council to S.X.T.
Footnotes
-
[Supplemental material is available for this article.]
-
Article is online at http://www.learnmem.org/cgi/doi/10.1101/lm.053777.123.
-
Freely available online through the Learning & Memory Open Access option.
-
↵1 We thank two reviewers for raising this possibility.
- Received April 4, 2023.
- Accepted October 12, 2023.
This article, published in Learning & Memory, is available under a Creative Commons License (Attribution-NonCommercial 4.0 International), as described at http://creativecommons.org/licenses/by-nc/4.0/.



