


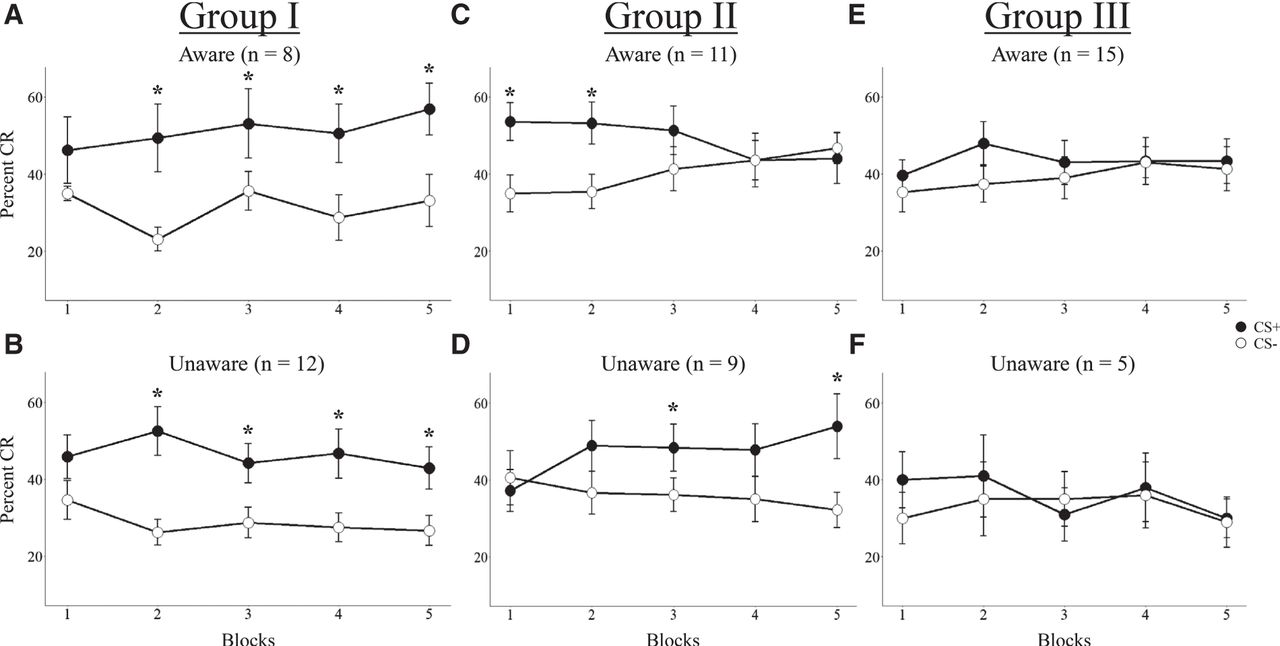
Figure 3.
% CRs broken down by group and awareness. (A,B) Both aware and unaware Group I participants showed greater % CRs to CS+ relative to CS− when CSs were distinct (1000 Hz vs. white noise). (C,D) Significantly greater % CRs to CS+ relative to CS− was observed early (Blocks 1 and 2) for aware participants and later (Blocks 3 and 5) for unaware participants when CSs were similar (1000 Hz vs. 1400 Hz). (E,F) No significant differences were detected when CSs were very similar (1000 Hz vs. 1150 Hz). (*) P < 0.05.



