


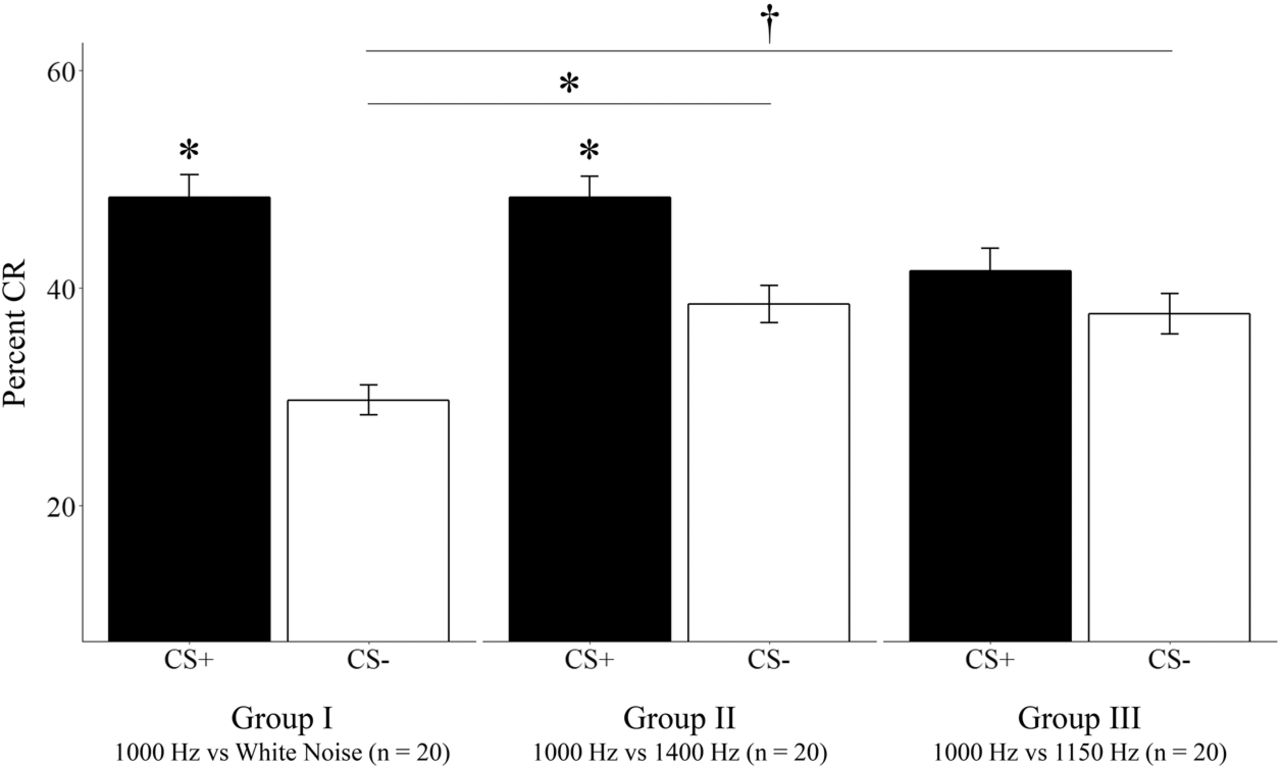
Figure 2.
Overall % CRs to CS+ and CS− trials for each group. Participants in Groups I and II showed significantly greater CRs to CS+ relative to CS− while participants in Group III did not. Relative to Group I, Group II showed greater % CRs to CS− trials and Group III showed a trend. (*) P < 0.05, (†) P < 0.07.



