


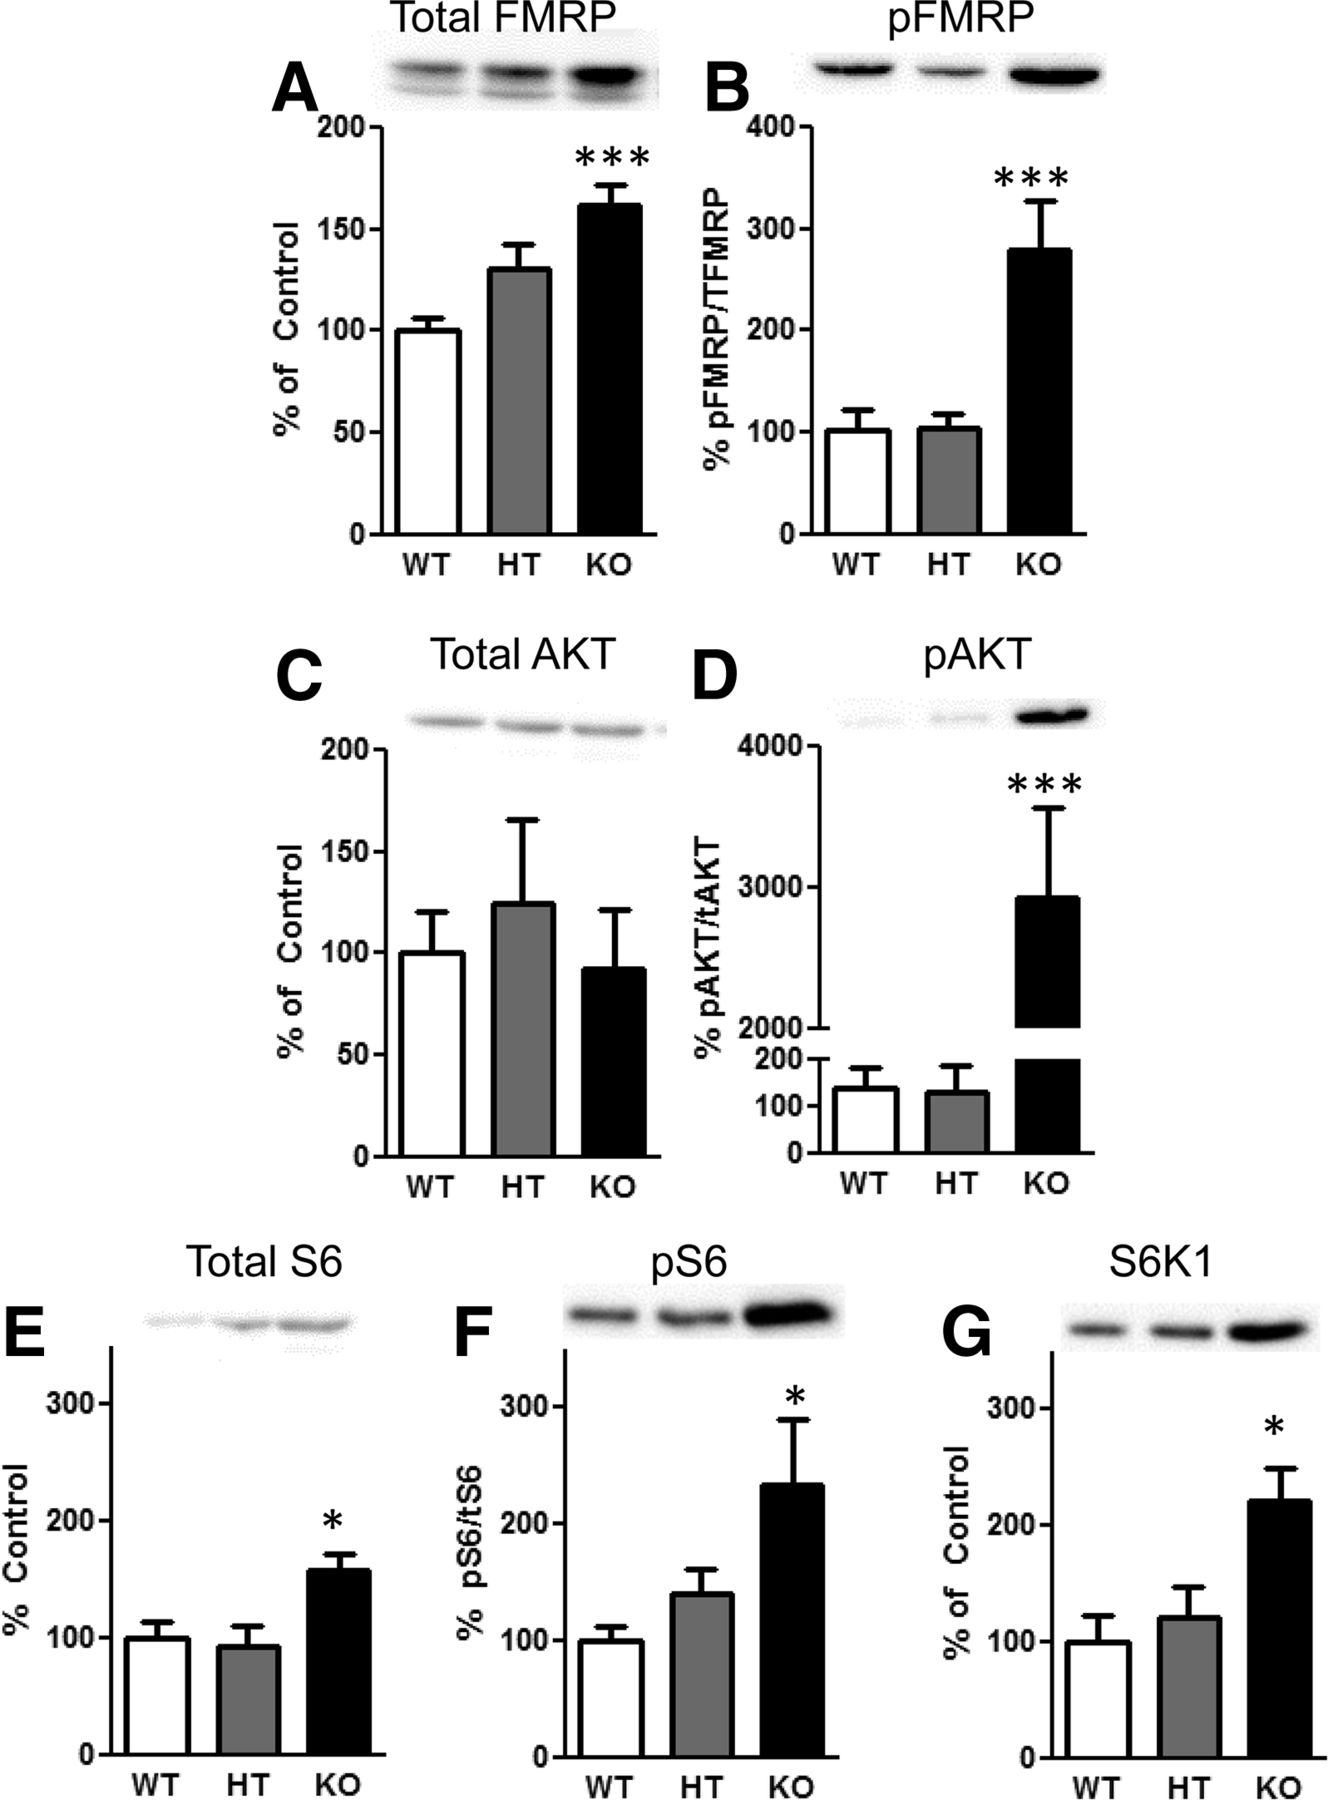
Mutation in PTEN results in elevated levels of fragile X mental retardation protein (FMRP) and phosphorylated FMRP in hippocampus NS-Pten knockout (KO) mice. Western blotting was performed in hippocampal samples from NS-Pten wild-type (WT), heterozygous (HT), and KO mice. Representative immunoblots from hippocampal proteins are shown above each graph. (A) Graph shows the mean (±SEM) for total FMRP in wild-type (WT), heterozygous (HT), and knockout mice (KO). (B) Graph shows the mean (±SEM) for phosphorylated FMRP levels in WT, HT, and KO. (C) Graph shows the mean (±SEM) for total AKT in WT, HT, and KO. (D) Graph shows the mean (±SEM) for phosphorylated AKT in WT, HT, and KO. (E) Graph shows the mean (±SEM) for total S6 in WT, HT, and KO. (F) Graph shows the mean (±SEM) for phosphorylated S6 in WT, HT, and KO. (G) Graph shows the mean (±SEM) for S6K1 in WT, HT, and KO. The primary antibodies used were as follows: FMRP, ribosomal S6 protein, P-S6 (S240/244), AKT, P-AKT (S473), and S6K1 (1:500, Cell Signaling Technology), phosphorylated FMRP-S499 (1:500, Abcam), and actin (1:1000, Sigma Chemical Co.). Total homogenate samples were used for total and phosphorylated AKT, total and phosphorylated S6, and S6K1. Synaptosomal preparations were used for total and phosphorylated FMRP. All primary antibodies were incubated with the membranes overnight at 4°C, followed by incubation with a 1:20,000 goat HRP tagged anti-rabbit IgG secondary antibody (Cell Signaling Technology). Immunoreactive bands were visualized by ECL Prime (GE Healthcare), images were captured on the Proteinsimple FluroChem E & M imager (Santa Clara), and immunoreactivity was quantified using Proteinsimple software (AlphaView SA). The band for each sample was normalized to its actin level. Optical densities of phospho-proteins were normalized to the levels of total protein from the same sample and are depicted as a ratio of phospho-to-total protein level. n = 12 per group for the total and phosphorylated FMRP/total western blots; n = 6 per group for total AKT, phosphorylated AKT, total S6, phosphorylated S6, and S6K1. Significant group difference: (*) P < 0.05, (***) P < 0.001.



