


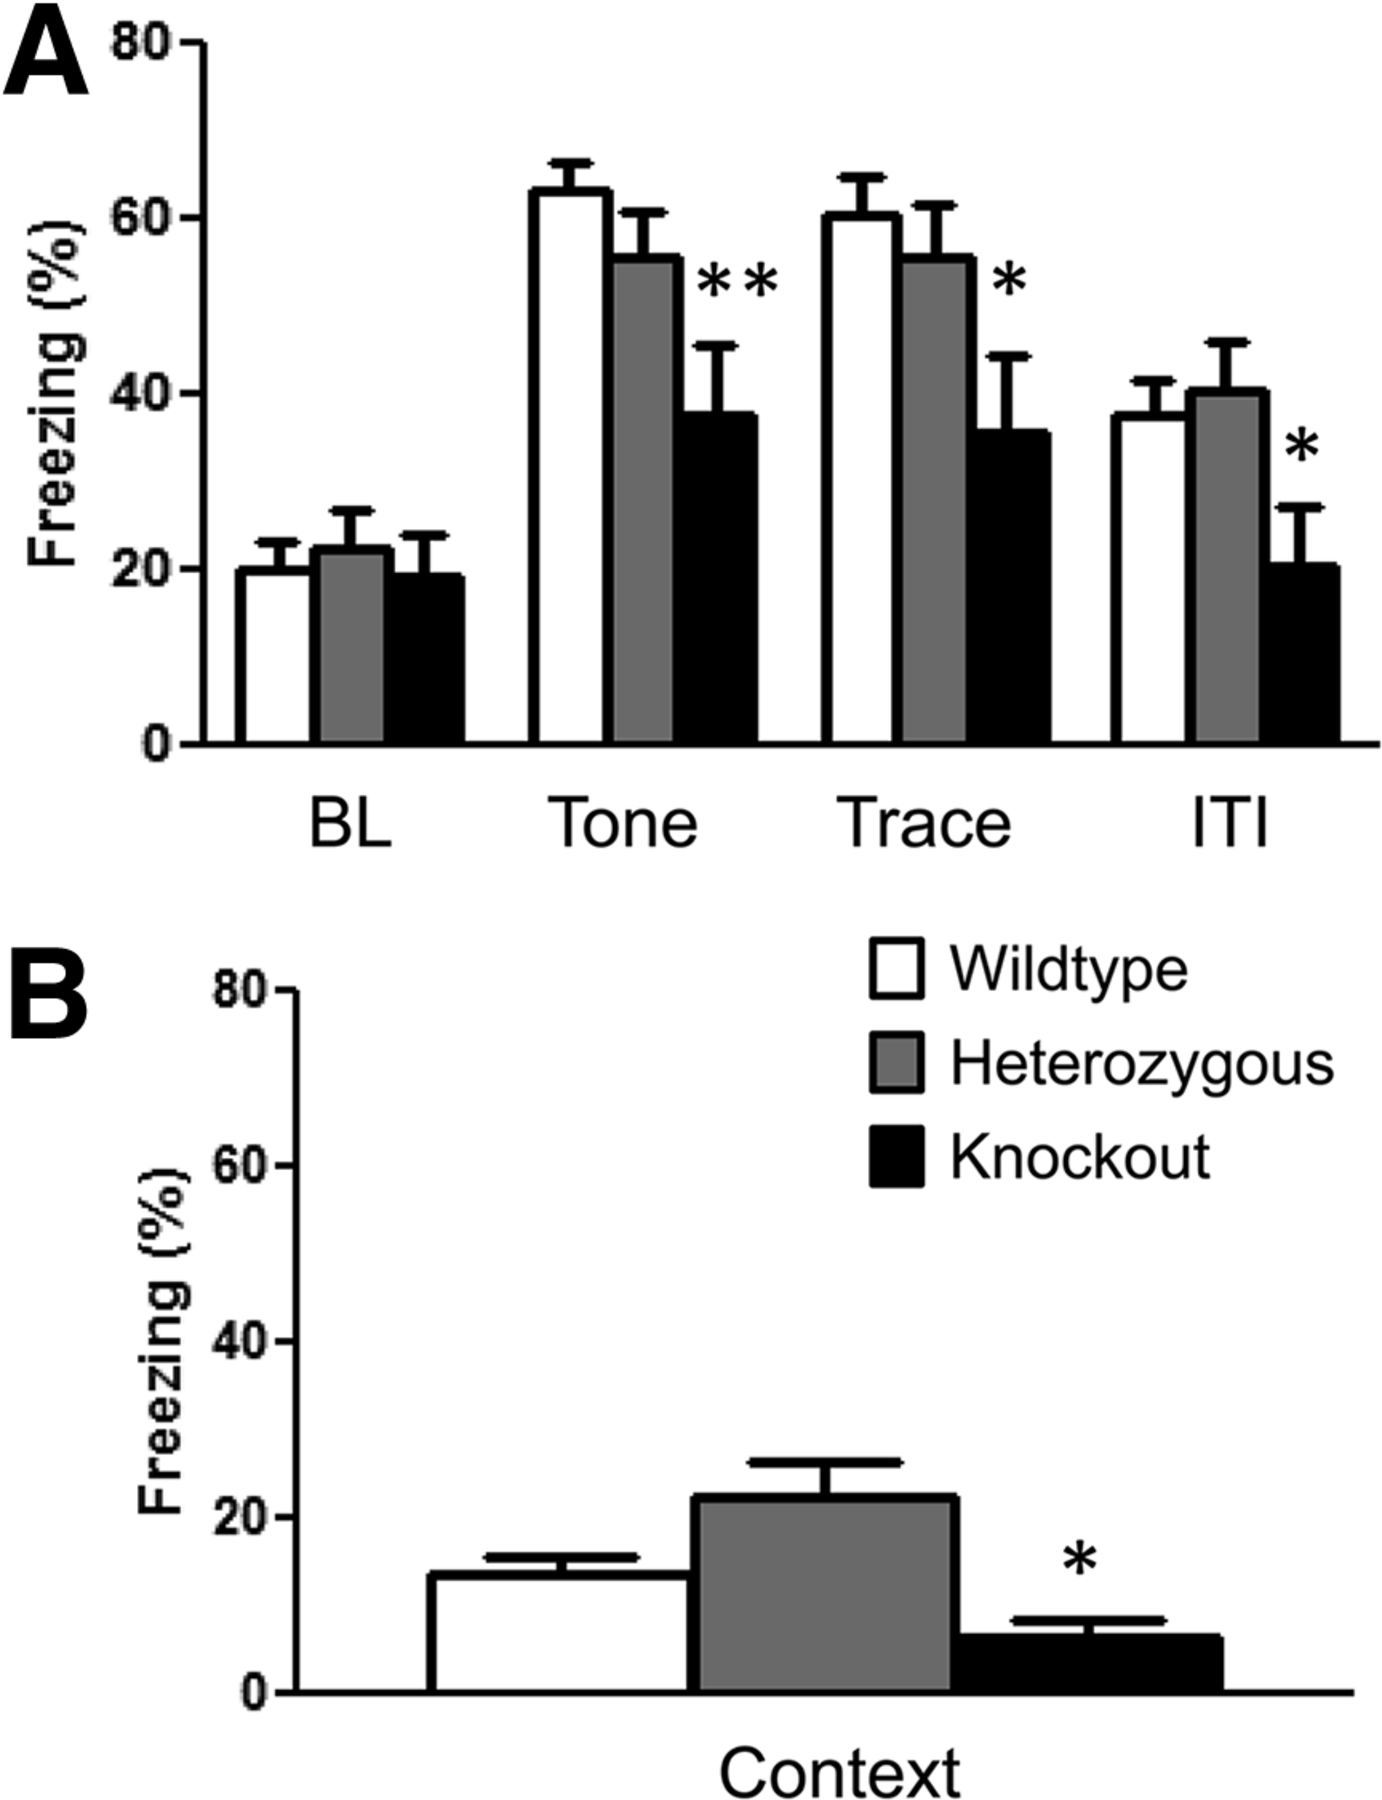
Figure 2.
Mutation in PTEN results in trace memory deficits and deficits in contextual memory. (A) Graph shows the mean (±SEM) percent time freezing during the trace memory testing 24 h after training. (B) Graph shows the mean (±SEM) percent time freezing during the context test. n = 31, 20, 12 for WT, HT, and KO, respectively. Significant group difference: (**) P < 0.01, (*) P < 0.05).



