


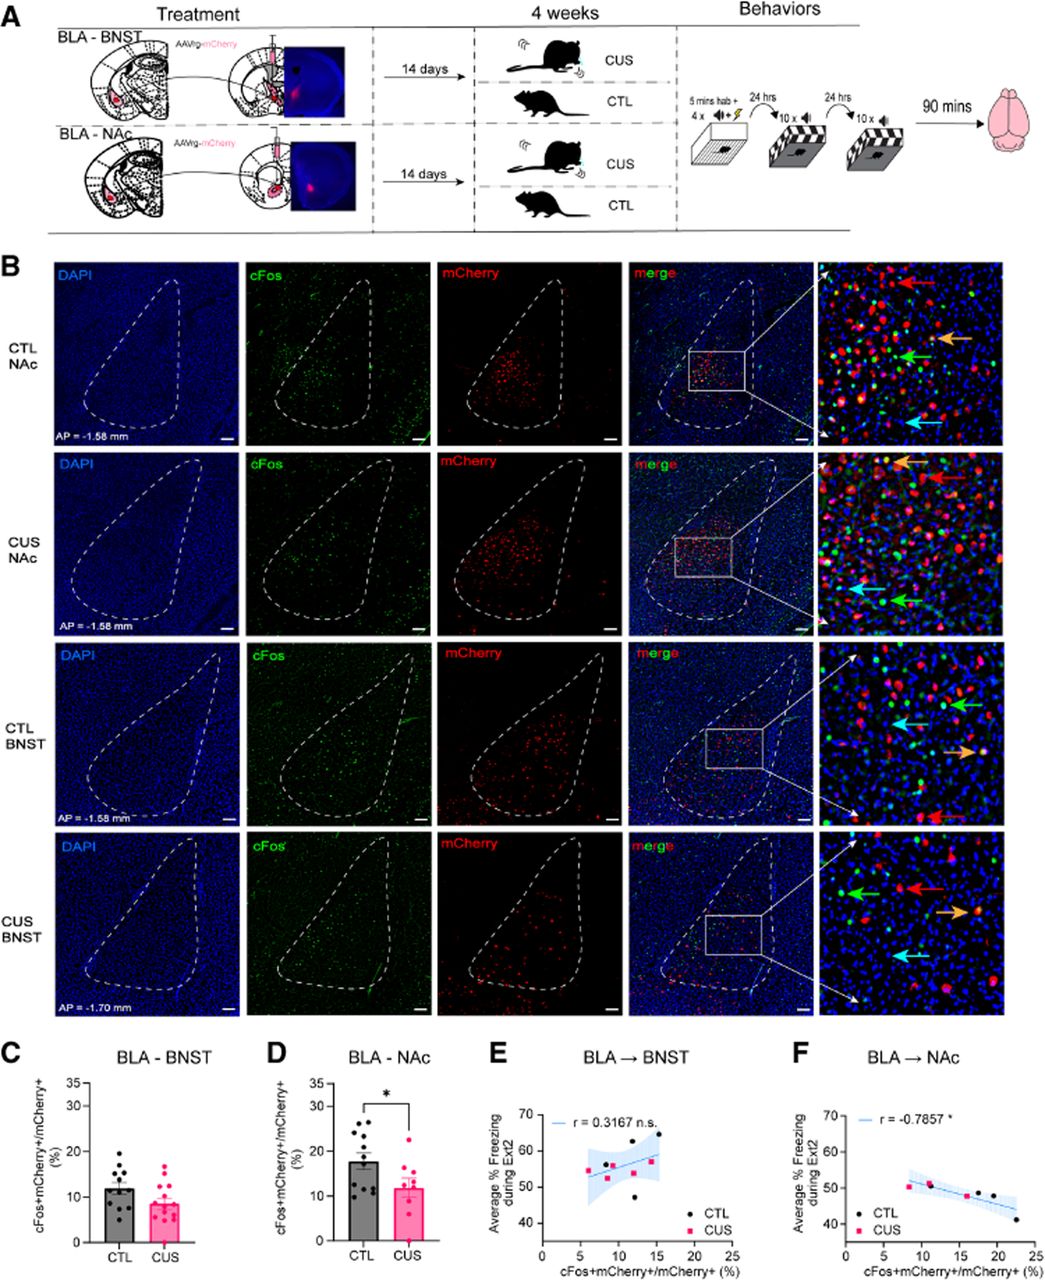
Chronic stress shifts ensemble activation. (A) Experimental time line of retrograde labeling and ensemble identification. Stereotaxic injection and target validation of pAAV-hSyn-mCherry retrograde virus into either BNST (CUS N = 5, CTL N = 4) or NAc (CUS N = 3, CTL N = 4); adapted from Paxinos and Franklin (2019). (B) Representative images of DAPI, c-Fos expression, and m-Cherry in BLA-NAc neurons are shown. Within the merged image, blue arrow indicates a DAPI+ cell, green arrow indicates cFos+ cell, red arrow indicates mCherry+ cell, and orange arrow indicates a mCherry+ cell colocalized with cFos+. (C) There was no statistically significant difference in the activation of BLA-BNST neurons between the CUS and CTL groups (unpaired t-test, t(24) = 1.940, P = 0.0643, # data points = 12–14/group, # outlier = 0–1/group removed). (D) The percent activation of BLA-NAc neurons is decreased in mice exposed to CUS compared to CTL (unpaired t-test, t(19) = 2.095, P = 0.0498, # data points = 9–12/group, # outlier = 0/group removed). (E) There is no significant correlation between activation of the BLA-BNST pathway with freezing during extinction day 2 (Spearman's correlation, r = 0.3167, P = 0.4101). Regression line: Y = 0.676 X + 48.70. (F) There is a negative correlation between BLA-NAc pathway activation with freezing during extinction day 2 (Spearman's correlation, r = −0.7857, P = 0.0480). Regression line: Y = −0.562 X + 56.70. Data are presented as mean ± SEM; N = 3–5/group, three data points/mouse along BLA AP-axis; (*) P < 0.05. Scale bar, 100 µm.



