


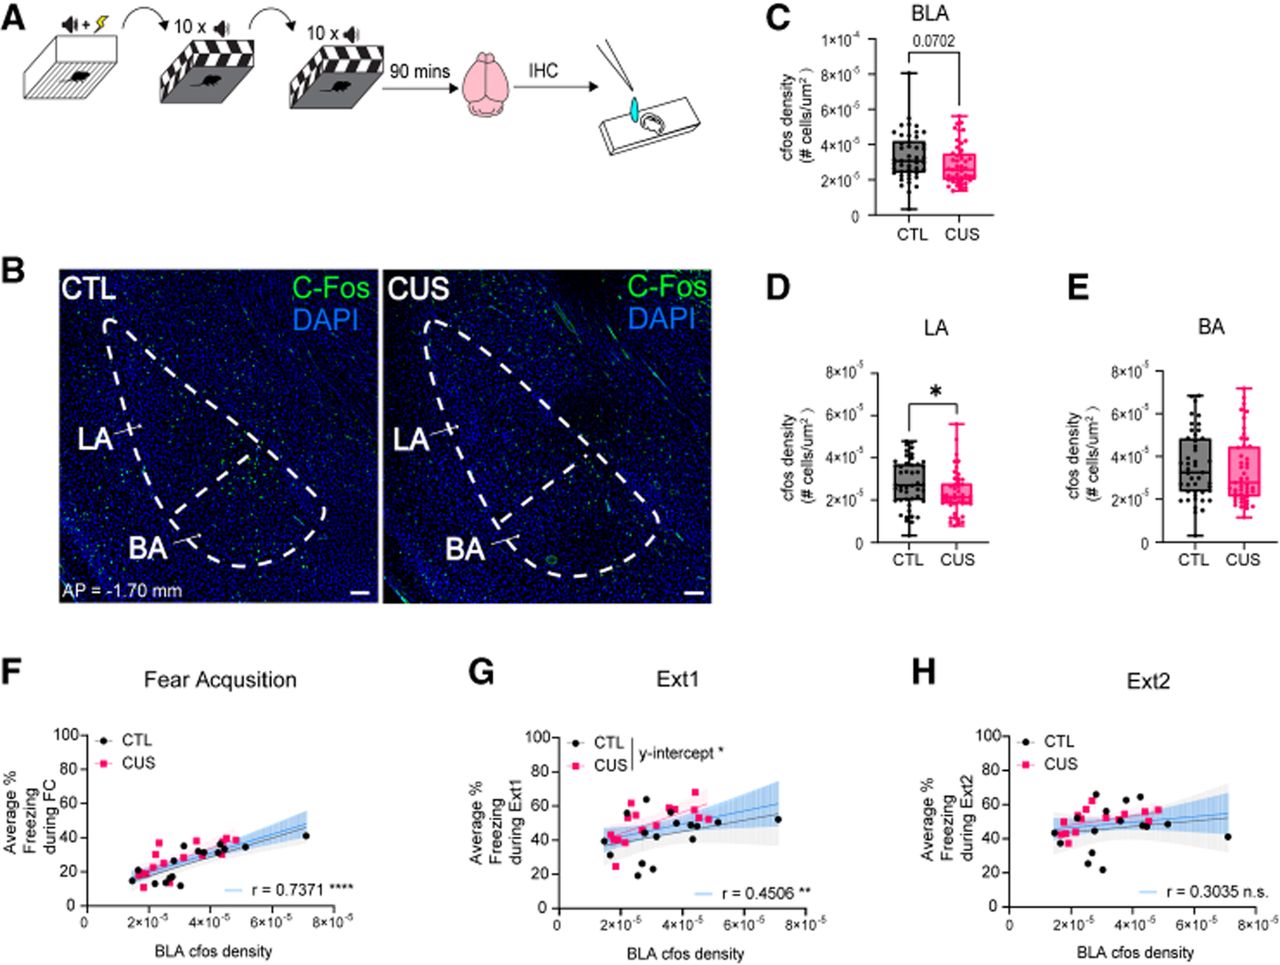
Chronic stress refines memory ensemble recruitment. (A) Experimental time line for postextinction ensemble identification. Brains were collected after extinction day 2, and c-Fos immunohistochemistry on BLA tissue was performed. (B) Representative images of c-Fos expression in the BLA. (C) CUS group had a trend to a lower BLA c-Fos expression compared to CTL group (Mann–Whitney test, U = 845, P = 0.0702, # data points = 46–47/group, # outliers = 1/group removed). (D) CUS led to lower c-Fos expression in the lateral amygdala (LA) compared to CTL (Mann–Whitney test, U = 797, P = 0.0199, # data points = 46–48/group, # outliers = 0–1/group removed). (E) CTL and CUS had comparable c-Fos expression in the basal amygdala (BA) (Mann–Whitney test, U = 946, P = 0.3877, # data points = 45–47/group, # outliers = 1–2/group removed). (F) Average % freezing during entire fear conditioning training session was significantly correlated with BLA c-Fos density (Spearman's correlation, r = 0.7371, P < 0.0001). Simple linear regression slopes and intercepts were not different between CUS and CTL groups (slopes: F(1,28) = 0.187, P = 0.6687; Y-intercepts: F(1,29) = 4.04, P = 0.0539). Regression lines for CTL (black, Y = 557,737 X + 6.39), CUS (pink, Y = 638,544 X + 8.35), and combined (blue, Y = 555,324 X + 8.65) were shown. (G) Average % freezing during entire extinction day 1 was significantly correlated with BLA-cFos density (Spearman's correlation, r = 0.4506, P = 0.0097). Simple linear regression slopes were not different between CUS and CTL mice, but intercepts were significant (slopes: F(1,28) = 0.8916, P = 0.3531; Y-intercepts: F(1,29) = 5.327, P = 0.0283). Regression lines for CTL (black, Y = 330,820 X + 31.80), CUS (pink, Y = 626,092 X + 31.26), and combined (blue, Y = 378,481 X + 34.39) were shown. (H) Average % freezing during entire extinction day 2 was not significantly correlated with BLA-cFos density (Spearman's correlation, r = 0.3035, P = 0.0912). Simple linear regression slopes and intercepts were not different between CUS and CTL groups (slopes: F(1,28) = 0.112, P = 0.7407; Y-intercepts: F(1,29) = 2.12, P = 0.1563). Regression lines for CTL (black, Y = 161,175 X + 40.80), CUS (pink, Y = 262,520 X + 42.90), and combined (blue, Y = 160,792 X + 43.40) were shown. Data are presented as a box-and-whisker plot with whiskers showing minimum and maximum, (*) P < 0.05. Scale bar, 100 µm.



