


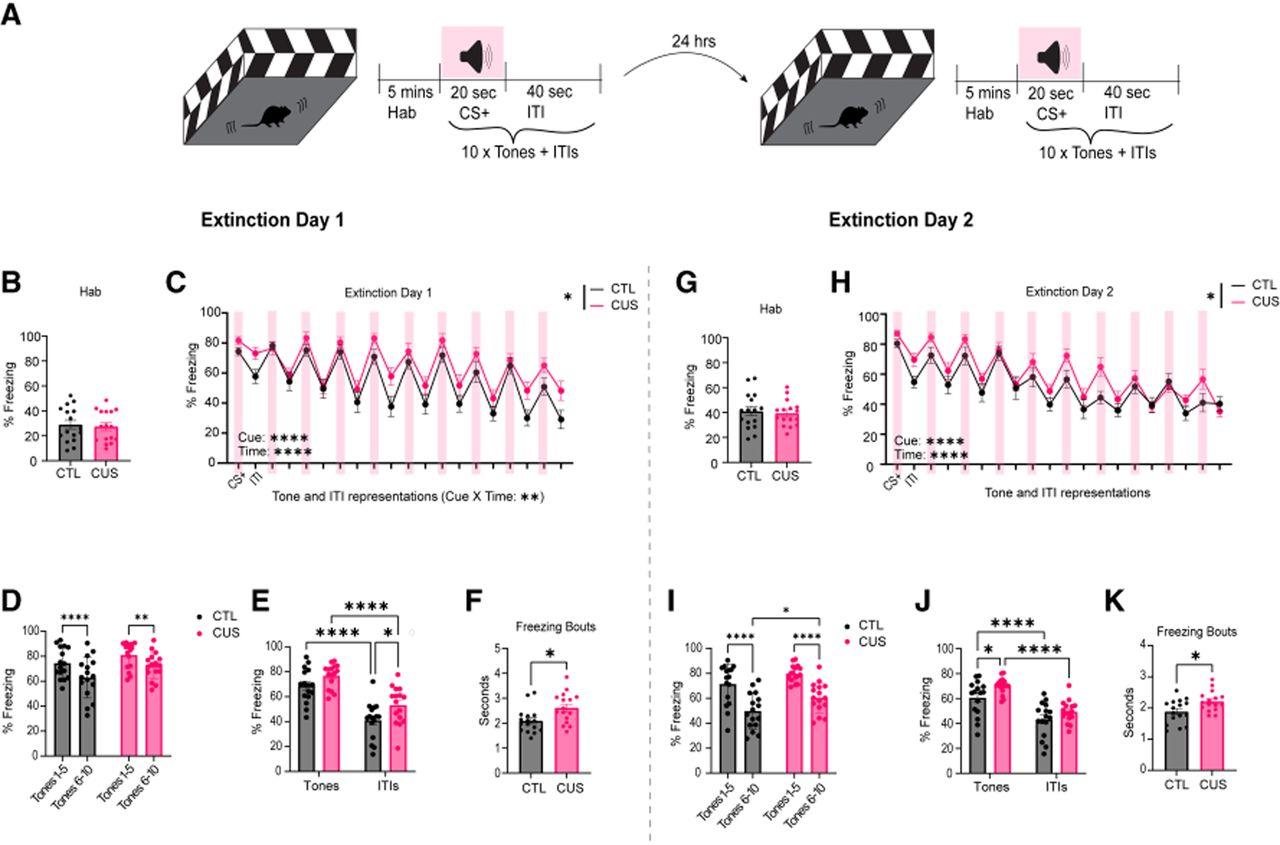
Chronic stress impacts fear extinction. (A) Experimental time line of the 2 day extinction paradigm. On each day, mice were habituated to context B for 5 min and then exposed to ten 20 sec tones with 40 sec intertrial intervals. (B) CUS and CTL groups had similar levels of freezing during habituation on extinction day 1 (unpaired t-test, t(30) = 0.3058, P = 0.7619). (C) The percent freezing across 10 CS+ tones and ITIs on extinction day 1 declined over repeated presentations (three-way ANOVA; time: F(9,270) = 9.689, P < 0.0001). Freezing was greater during tones than ITIs (cue: F(0.6971,20.91) = 233.1, P < 0.0001), declined faster to ITIs (time × cue: F(6.979,209.4) = 3.034, P = 0.0047), and was enhanced by CUS (stress: F(1,30) = 5.185, P = 0.0301). (D) Both groups exhibited with-session extinction learning on extinction day 1, as average percentage of freezing during the last five tone presentations was significantly reduced compared to the first five tones (two-way repeated-measures ANOVA; time: F(1,30) = 35.22, P < 0.0001; stress: F(1,30) = 3.689, P = 0.0643; time × stress interaction: F(1,30) = 0.7933, P = 0.3802). Post hoc Sidak's tests revealed significantly lower freezing during the last five tones in both CUS (P = 0.0025) and CTL (P < 0.0001) groups. (E) Average percent freezing during tones and ITIs on extinction day 1 was greater for tones than ITIs (two-way repeated-measures ANOVA; cue: F(1,30) = 233.1, P < 0.0001) and elevated in CUS mice (stress: F(1,30) = 5.185, P = 0.0301). Although there was no significant cue and stress interaction (F(1,30) = 1.549, P = 0.2229), post hoc Sidak's tests were significant in ITIs CTL versus CUS (P = 0.0252), CTL tones versus ITIs (P < 0.0001), CUS tones versus ITIs (P < 0.0001), but not in tones CTL versus CUS (P = 0.1838). (E) CUS did not affect fear recall measured by average freezing during the first three tones (unpaired t-test, t(30) = 1.160, P = 0.2552). (F) CUS had longer freezing bouts than CTL during extinction day 1 posthabituation period (unpaired t-test, t(30) = 2.638, P = 0.0131). (G) The average percent time freezing was similar between CUS and CTL groups during habituation on extinction day 2 (unpaired t-test, t(30) = 0.3839, P = 0.7038). (H) The percent time freezing across 10 tones and ITIs on extinction day 2 declined over repeated presentations (three-way ANOVA; time: F(9,270) = 19.61, P < 0.0001) was greater during tones (cue: F(0.6866,20.60) = 215.4, P < 0.0001), and increased in CUS mice (stress: F(1,30) = 4.421, P = 0.0440). (I) Both groups exhibited within-session extinction learning on extinction day 2, as the average percentage of freezing during the last five tone presentations was significantly reduced compared to the first five tones (two-way repeated-measures ANOVA; time: F(1,30) = 71.40, P < 0.0001; stress: F(1,30) = 6.177, P = 0.0187; time × stress interaction: F(1,30) = 0.2258, P = 0.6381). Post hoc Sidak's tests revealed significantly lower freezing during the last five tones in both CUS (P < 0.0001) and CTL (P < 0.0001) groups. In addition, the CUS group had significantly higher freezing than the CTL group in the last five tone presentations (P = 0.0429). (J) Average percent freezing during tones and ITIs on extinction day 2 showed that mice froze more during tones than ITIs (two-way repeated-measures ANOVA; cue: F(1,30) = 215.4, P < 0.0001), and CUS mice froze more overall (stress: F(1,30) = 4.421, P = 0.0440). Although there was no significant cue × stress interaction (F(1,30) = 1.614, P = 0.2137), post hoc Sidak's tests were significant in tones CTL versus CUS (P = 0.0385), CTL tones versus ITIs (P < 0.0001), and CUS tones versus ITIs (P < 0.0001), but not in ITIs CTL versus CUS (P = 0.2264). (K) The average duration of freezing bouts were longer in CUS mice compared to CTL during the extinction day 2 posthabituation period (unpaired t-test, t(30) = 2.574, P = 0.0152). Data are presented as mean ± SEM; N = 16/group; (*) P < 0.05.



