


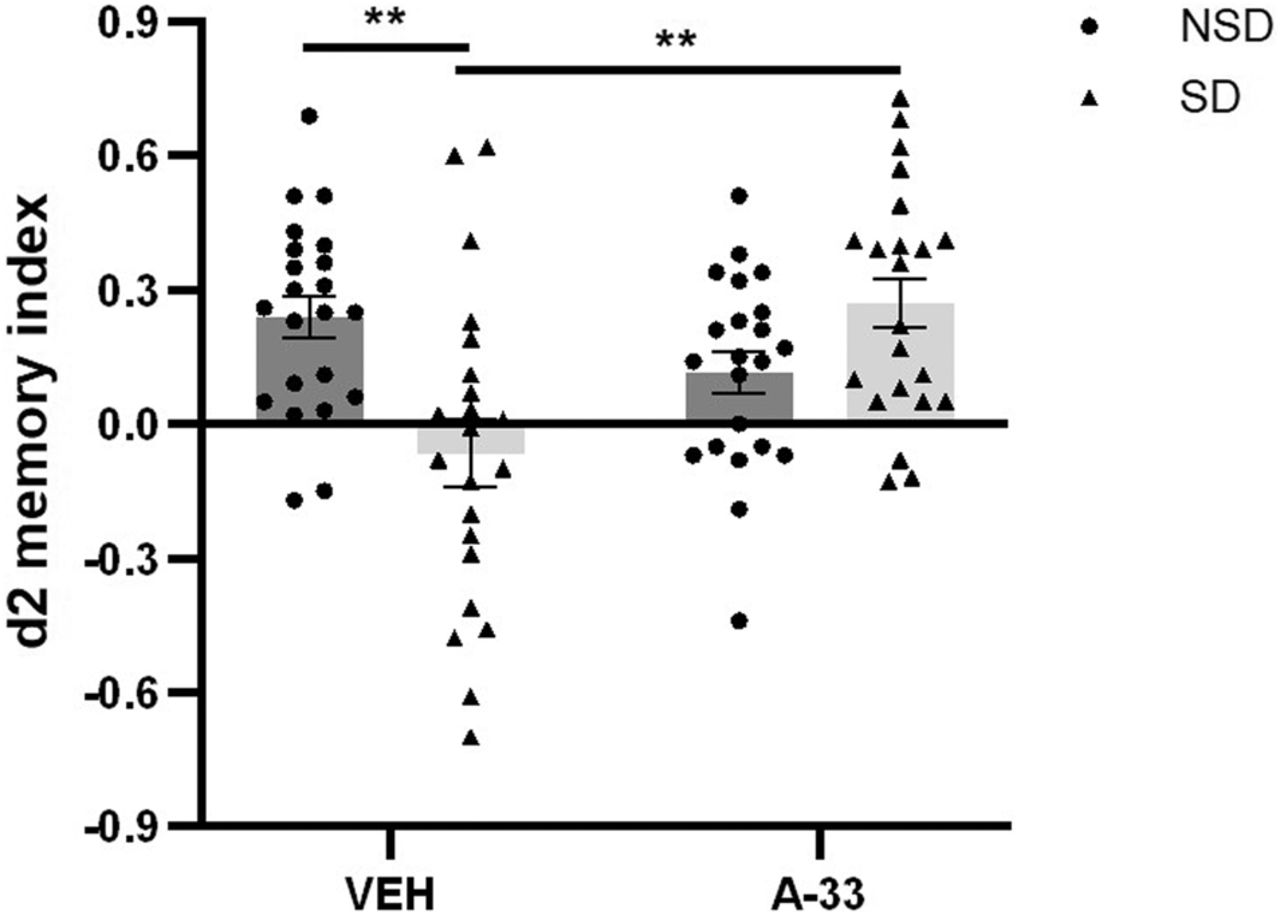
Figure 2.
Effects of A-33 and sleep conditions on OLT performance in mice. The pooled data of the vehicle groups are the same as presented in Figure 3. (SD) Sleep deprivation, (NSD) non-sleep deprivation, (OLT) object location task, (VEH) vehicle. Data represent mean (+SEM). (**) P < 0.01



