


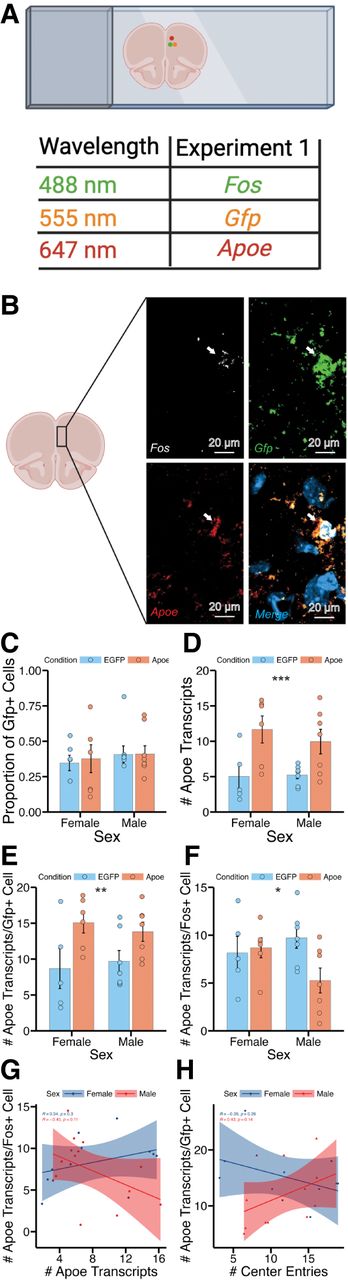
Apoe expression in the FC. (A) Schematic of experimental design for RNAscope verification of Apoe expression in the FC. (B) Representative confocal image showing coexpression of Fos, virally derived Gfp, and Apoe in FC tissue. (C) No significant differences in the proportion of cells expressing Gfp were observed as a function of group or biological sex. (D) The average number of Apoe transcripts per cell was significantly higher in the Apoe group compared to controls in both sexes (F(1,1) = 13.256, P = 0.00174, main effect of group). (E) The average number of Apoe transcripts per Gfp+ cell was significantly higher in the Apoe group compared to controls in both sexes (F(1,1) = 8.178, P = 0.01, main effect of group). (F) A group × sex interaction was observed for average number of Apoe transcripts per Fos+ cell, such that the number of Apoe transcripts in Fos+ cells was lower in male Apoe mice (F(1,1) = 4.367, P = 0.05). (G) Correlations between the number of Apoe transcripts per Fos+ cell, and the number of Apoe transcripts per cell, were significantly different between male and female mice (Cohen's q = 0.792, P = 0.047, Fisher's z-test). (H) Correlations between the number of Apoe transcripts per cell, and the number of center entries in the open field test, were significantly different between male and female mice (Cohen's q = −0.872, P = 0.032, Fisher's z-test). Error bars represent the standard error of the mean; dots are individual data points.



