


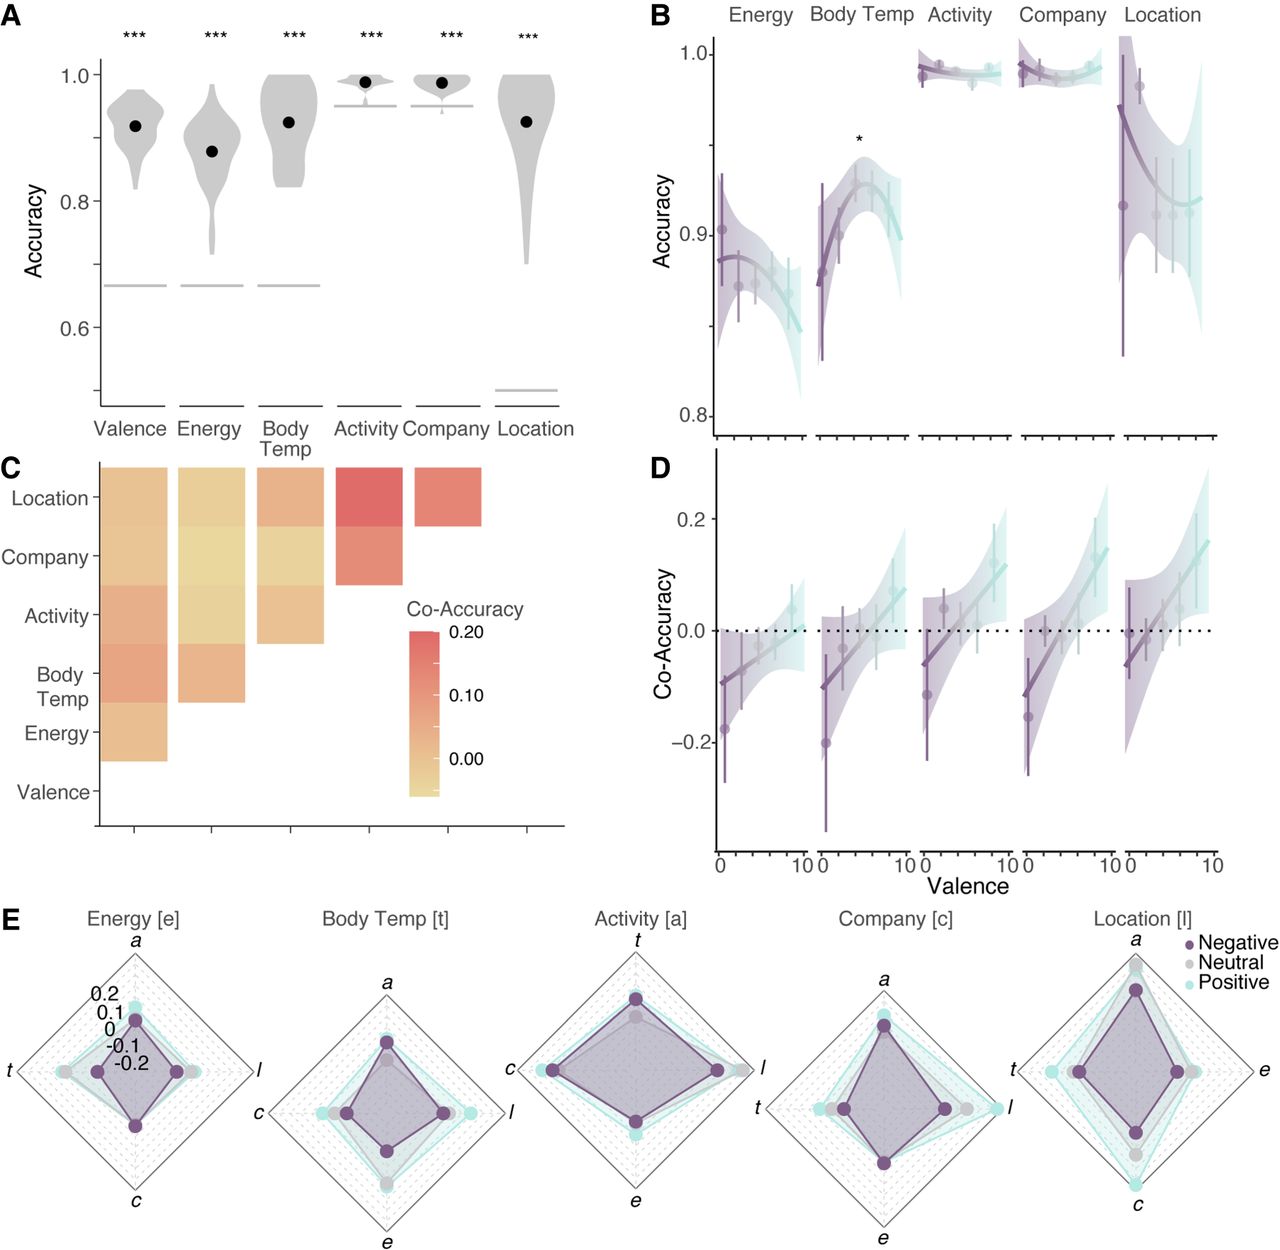
Experiment 2 results. (A) Memory accuracy per event feature. Gray lines = chance memory performance per feature; violin plots = actual memory performance per event; dot = mean memory performance per feature. (***) P < 0.001. (B) Memory accuracy per emotion experienced in that event. As in Figure 2, curves = quadratic model fits (probing effects of emotionality; shaded area = 95% CI). Dots = mean memory performance per valence ratings (for visualization only, showing average of two consecutive valence values; the model included memory per each valence rating from 0 to 10); error bars = standard error of the mean (SEM). (C) Average memory co-accuracy per event feature pair. For example, the top left square shows average co-accuracy value between location and valence. (D) Memory co-accuracy per emotion experienced in that event. As in B, dots show mean memory performance per valence ratings, error bars = SEM, lines = linear model fits (probing effects of valence; shaded area = 95% CI). Co-accuracy calculated per feature, see (E) for all pairwise comparisons. (E) Co-accuracy per feature pair, separated by valence. For the purpose of visualization, valence ratings of 0–3 are coded as negative, 4–6 as neutral, and 7–10 as positive. (*) P < 0.05; (**) P < 0.01; (***) P < 0.001.



