


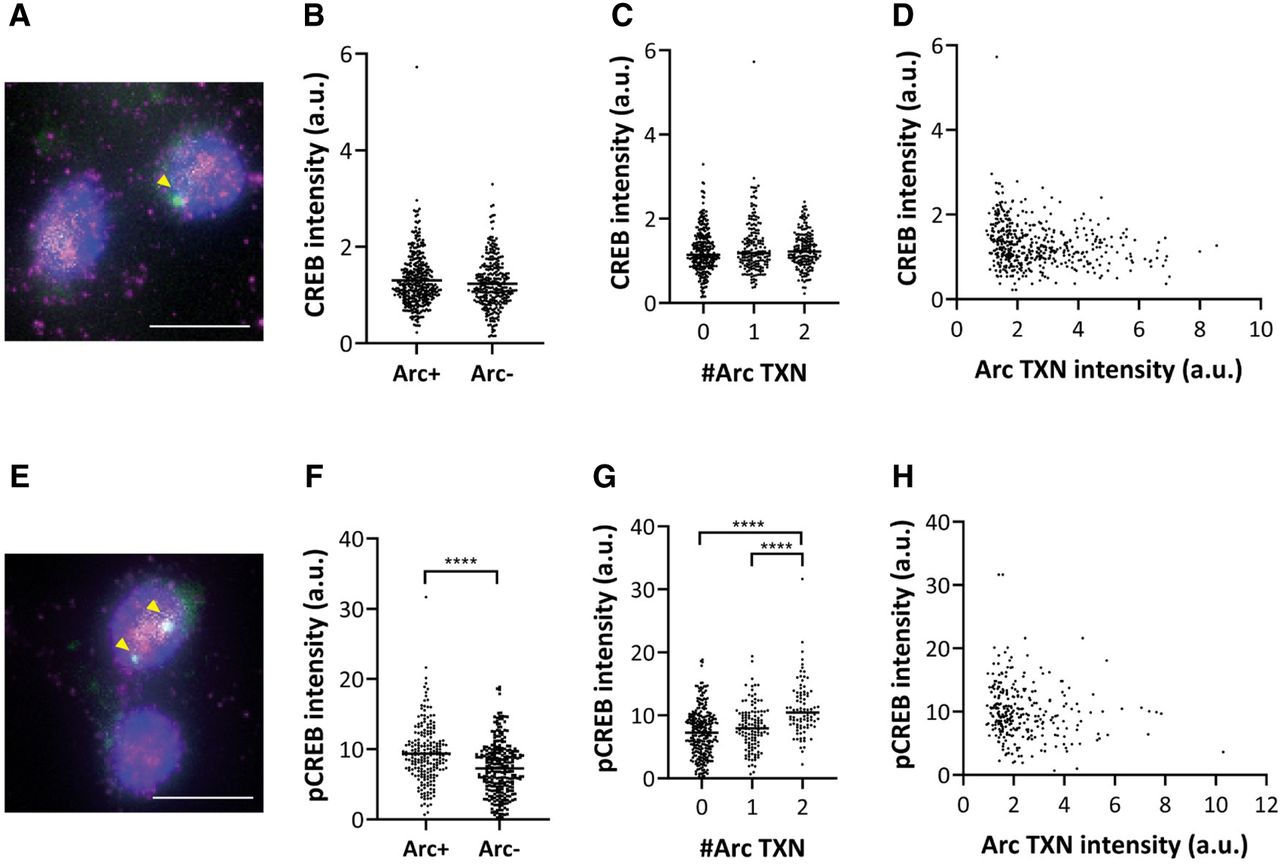
CREB and pCREB levels in Arc+ and Arc− cells. (A,E) Representative multichannel IF-smFISH image of CREB (A) or pCREB (E) protein (magenta), Arc mRNA (green), and DAPI (blue). Yellow arrowheads indicate transcription sites of Arc mRNA. (B) CREB intensity of Arc+ and Arc− cells (n = 346 for Arc+ cells, n = 279 for Arc− cells). (C) CREB intensity in neurons with 0, 1, and 2 Arc transcription sites (P = 0.1264 for one-way ANOVA test). (D) Scatter plot of CREB intensity and Arc transcription site intensity (n = 346 cells, r2 = 0.04469). (F) pCREB intensity of Arc+ and Arc− cells (n = 210 for Arc+ cells, n = 269 for Arc− cells, (****) P < 0.0001, two-tailed t-test). (G) pCREB intensity and the number of Arc transcription alleles (P < 0.0001 for one-way ANOVA test, (****) P < 0.0001, post hoc Tukey's t-tests). (H) Scatter plot of pCREB intensity and Arc transcription site intensity (n = 269 cells, r2 = 0.01987). Scale bars, 10 μm.



